Without a deep understanding of a business’ fundamentals, valuation becomes a difficult exercise. A weak franchise trading at 10x P/E multiple appears cheap, when its fair value P/E might actually be 5x. On the other hand, a consistent compounder trading at 50x appears expensive, when its fair value P/E could be higher than 100x. Conviction on the ability of a firm to deliver sustainable competitive advantage (represented by ROCE) as well as growth (which requires capital reinvestment) is often underappreciated in a P/E multiples based valuation methodology. In this newsletter, we quantify the relationship between longevity of healthy fundamentals and valuation for consistent compounders. “Aren’t you concerned about the current P/E multiples of your portfolio companies?” – This is (and perhaps will always remain) one of the most frequently asked questions about our PMS portfolio. In one of our recent blogs, Marcellus: Value Investing – The Indian Challenge, we gave an intuitive mathematical way of answering this question. In this newsletter, let’s make it a little more interesting by going one layer deeper. Relative P/E conundrum: Nestle India and Hindustan Unilever appear similar in quality with regards to their brands, MNC parentage (and hence access to a wide product portfolio), systems and processes, talent proposition etc. No wonder, they have appeared similar in fundamentals to the stock market as well – see table below. Over the last 20 years, Nestle and HUL have traded at similar trailing P/E multiples. However, the shareholder returns generated by these firms have diverged because of the divergence in their earnings growth trajectories over the same period. In particular, HUL has underperformed the Sensex over the past 20 years while Nestle India has outperformed the Sensex substantially over the same period. Hence, going by the the last 2 decades of share price performance, at the same P/E multiple HUL was over-valued 20 years ago and Nestle was undervalued.
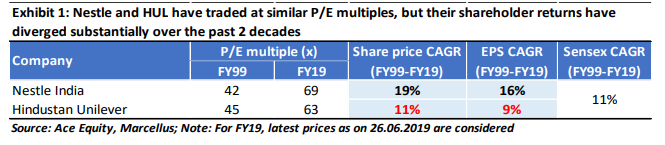
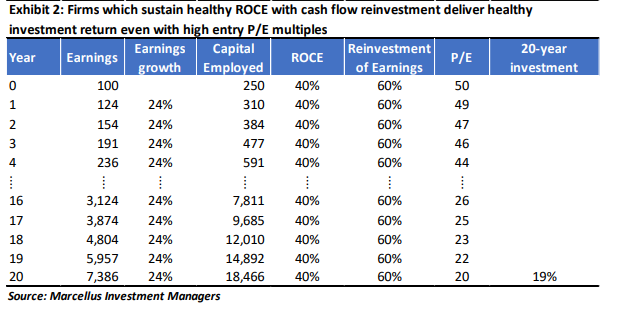
Absolute P/E conundrum: Nestle India’s P/E multiple was 64x (trailing) in 1994 and it is 69x currently i.e. the stock appeared expensive 25 years ago, and it might appear expensive today as well. However, investment in Nestle in 1994 at 64x P/E multiple would have fetched 17% CAGR (1994-2019) compared to 10% CAGR delivered by Sensex over the same time period. To put it in another way, investment in Nestle India at 290x P/E multiple in 1994 and exit at today’s price, would have delivered shareholder returns in line with Sensex. Hence, in 1994 Nestle’s fair valuation P/E multiple was 290x! Why do such conundrums exist? Let us start with an analogy. Let’s say you went to purchase a new car for yourself, and you were offered two cars by the car dealers – a Maruti Suzuki Swift Dzire for Rs 30 lakhs and a Bentley for Rs. 30 lakhs. Your instant reaction will be that the Swift Dzire is overvalued and that the Bentley is undervalued. Why? Because you are aware of the tangible utility and luxury offered by these cars which helps you to conclude that the fair value of Swift Dzire is substantially lower than Rs 30 lakhs and that of the Bentley is substantially higher than Rs 30 lakhs. But what if you were new to the car industry and this awareness was not there at all? What if the Swift Dzire marketing campaign talked about ride comfort in exactly the same manner as Bentley’s marketing campaign? Then you might not think that Bentley’s Rs 30 lakhs price tag is deeply undervalued and that Swift Dzire’s Rs 30 lakhs price tag is substantially overvalued. Now, let’s get back to the stock market. If you go by first principles, the fair value of any firm is the present value of all expected future cash flows. However, it is difficult to predict the future because of the uncertain interplay between continuity and disruption. As a result, at the same price tag of 45x P/E multiple in 1999, both Nestle and Unilever appeared similar in quality to most investors. More importantly, at that price tag, both appeared ‘expensive’, when Nestle turned out to be significantly cheap at that price tag (and HUL turned out to be radically overvalued). Almost 99% of the companies listed on the stock exchanges, have historically exhibited a very high degree of volatility in their revenues, earnings and ROCE. Due to such weak and unpredictable fundamentals, even at 10x / 20x / 30x P/E multiples, they have proved to be over-valued. The remaining 1% are firms which have delivered consistency of healthy fundamentals over several decades in a row. Such firms have been found to be undervalued even at P/E multiples of 30x / 40x / 50x, as quantified below. Valuing longevity of healthy fundamentals The most sustainable way for a firm to grow its earnings over the longer term is to deliver ROCE (returns on capital employed) substantially higher than the cost of capital (around 15% in India) and then plough this free cash flow back into the business to grow the capital employed whilst sustaining its high ROCE (which in turn generates the free cash flow to fund the next wave of earnings growth). Let us assume that an investor builds conviction in a company’s ability to: a) sustain 40% ROCE for the next 20 years (from 2020 to 2040); and b) maintain a dividend payout ratio of 40% i.e. it reinvests the balance 60% earnings back in the business and generates 40% ROCE on this incremental capital employed. Let us further assume that, in 2040, the firm will trade at the long term market average P/E multiple of 20x i.e. after 2040, the firm is not expected to deliver any better fundamentals compared to the broader market. The table below shows that entry into such a firm at 50x P/E multiple will fetch an investment return 19.2% CAGR from 2020 to 2040. [You can see a more detailed example of this in the Appendices to our book “Coffee Can Investing: the Low Risk Route to Stupendous Wealth”.]
Here is a practical example of this phenomenon – on 31st March 1994, Asian Paints was trading at a trailing P/E multiple of 38x. A decade hence, on 31st March 2004, Asian Paints’ trailing P/E multiple had de-rated to 20x. Despite this de-rating, an investment in Asian Paints at 38x P/E multiple in 1994 would have grown at 14% CAGR till 2004 whilst the Sensex delivered only 4% CAGR over the same time period. This was because Asian Paints maintained an average ROCE of 32% with an average rate of reinvestment of earnings being 54% over these 10 years. Moreover, the period of 1994-2004 was not the only period when Asian Paints maintained a healthy ROCE and capital reinvestment rate. It has had such stellar track record of consistency for more than seven decades now! The chart below gives the fair value of 20 years longevity of all types of consistent compounders, assuming that after 20 years, such a firm will trade at a P/E multiple of 20x. On this chart, an investor can choose the next 20 years’ expected sustainable ROCE on the horizontal axis, and also choose the curve relating to the firm’s expected cash flow reinvestment rate. On the vertical axis, the chart shows today’s fair value at which if the firm’s shares are bought and held for the next 20 years, the investment will deliver a CAGR of 11% (i.e. market average return). Any entry point below this fair value will help the investor outperform the broader market. So, for example, if we invest in companies which reinvest 50% of their free cash flows and generate ROCEs of 40% today (this is the typical profile of stocks in our portfolio), we can deliver 11% per annum over the next 20 years even if we invest in stocks with P/E multiples today in excess of 100x !! [See the RED dashed circle on the chart]
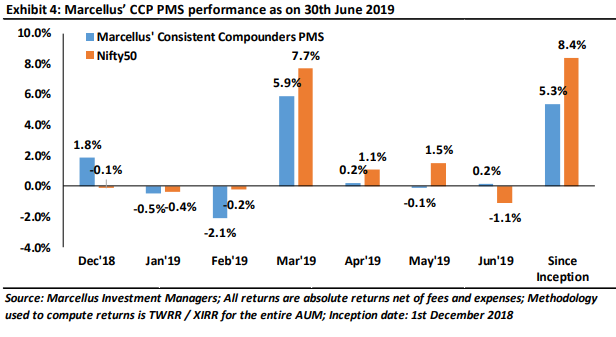
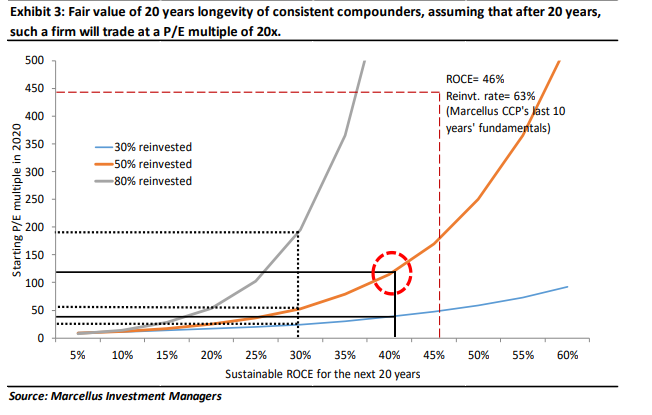 More generally, Marcellus’ Consistent Compounders PMS invests in stocks where we expect their fundamentals to be healthy and consistent over the long-term future. Our current portfolio’s (ex-BFSI) average ROCE for the last 10 years has been 46% and cash flow reinvestment rate over the last 10 years has been 63%. Marcellus’ Consistent Compounders PMS – Performance update We have a coverage universe of around 25 stocks, which have historically delivered a high degree of consistency in ROCE and revenue growth rates. Our research process involves understanding the reasons why companies in our coverage universe have consistently delivered superior financial performance. Based on this understanding, we construct a portfolio of 10-15 companies with an intended average holding period of stocks of 8-10 years or longer. The latest performance of our PMS is shown in the chart below.
Regards,
Team Marcellus
If you want to read our other published material, please visit https://marcellus.in/resources/ Note: the above material is neither investment research, nor investment advice.Marcellus Investment Managers is regulated by the Securities and Exchange Board of India as a provider of Portfolio Management Services and as an Investment Advisor. Copyright © 2019 Marcellus Investment Managers Pvt Ltd, All rights reserved.
Disclaimer
Marcellus Investment Managers is regulated by the Securities and Exchange Board of India as a provider of Portfolio Management Services and as an Investment Advisor.
The information provided on this Newsletter does not, and is not intended to, constitute investment advice; instead, all information, content, and materials available on this newsletter are for general informational purposes only. Information on this website may not constitute the most up-to-date information. The enclosed material is neither investment research, nor investment advice. The contents and information in this document may include inaccuracies or typographical errors and all liability with respect to actions taken or not taken based on the contents of this Newsletter are hereby expressly disclaimed. The content on this Newsletter is provided "as is;" no representations are made that the content is error-free.
No reader, user, or browser of this Newsletter should act or refrain from acting on the basis of information on this Newsletter without first seeking independent advice in that regard. Use of, and access to, this website or any of the links or resources contained within the site do not create an portfolio manager -client relationship between the reader, user, or browser and website authors, contributors and their respective employers. The views expressed at, or through, this site are those of the individual authors writing in their individual capacities only.
