In every decade, typically 50% of Nifty companies are ejected from the benchmark index leaving in their wake disappointed shareholders. Jim Collins’ bestseller “How the mighty fall…” provides a framework for assessing how companies get dislodged from their market leadership positions. We twin this framework with our proprietary ‘Lethargy’ & ‘Succession Planning’ frameworks to improve the odds that our portfolio companies will compound their free cashflows for significantly longer than what consensus estimates assume.
“Every Institution is vulnerable, no matter how great. No matter how much you’ve achieved, no matter how far you’ve gone, no matter how much power you’ve garnered, you are vulnerable to decline. There is no law of nature that the most powerful will inevitably remain at the top. Anyone can fail and most eventually do.” – Jim Collins in his book ‘How the mighty fall and why some companies never give in’ (2009)
Life in the Nifty: 50% probability of being kicked out a decade hence
On an average, only 40-50% of the Nifty 50 index constituents continue to remain in the index after a decade. For instance – of the Nifty 50 companies as of March 2000-end, only 44% of the companies continued to remain in the index as at March 2010; similarly, only 56% of March 2010-end Nifty50 constituents could find a place in the March 2020-end Nifty 50 index.
The key reason for such a high level of churn in the Nifty50 is the inability of most incumbents to sustain their superior fundamentals over an extended period of time. Companies that entered Nifty50 over FY10-20 had a median RoCE of 21% in the year of entry; in contrast, companies that exited the index over the same time period had a median RoCE of only ~10% indicating the extent of deterioration in the fundamentals.
As one would expect, upon exiting, these companies see a significant decline in their market capitalisation and thus the wealth of their shareholders – companies that exited Nifty50 index over FY10-20 period saw median share price decline of 15% over the next 2 years!
History suggests that there is a probability of around 50% that today’s Nifty50 incumbents won’t be in the index a decade hence. So how do we as investors assess whether the current greatness of our portfolio companies can sustain?
Jim Collins’ ‘Five Stage of Decline’ framework to identify how great companies slide
Jim Collins’ celebrated book ‘How the mighty fall and why some companies never give in’ published in 2009 provides a useful framework to identify early signs whether that a hitherto successful company is now declining.
The journey of a company from greatness to failure is analogous to a terminal disease. During the initial phase, curing the disease is easy but its existence is difficult to detect, whilst during the final phase the disease becomes all-pervasive, but cure becomes difficult. Jim Collins has laid out the following ‘Five Stages of Decline’ framework:
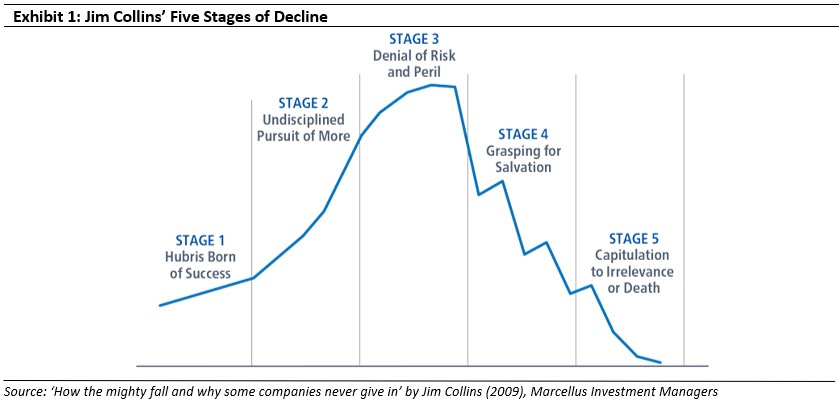
We describe the five stages of decline below:
1. Hubris Born of Success:
During the initial stage, the previously developed moat in the core business of the company continues to translate into high pricing power, high RoCEs and healthy free cash flow generation. However, this leads to ‘arrogance negligence’ where the management begins to believe that luck had no part to play in their success and they will continue to be successful in whatever they do. The idea of competition beating them in their core business sounds ridiculous to the management of the leading firm. The leading firm finds it hard to believe that their business could ever be disrupted. Such complacency leads to a deterioration in the quality of capital allocation which leads to low RoCEs on incremental invested capital. At this stage, the share price appreciation continues because of the competitive advantage in the core business. It is almost impossible for any external stakeholder to detect the decline at this stage.
2. Undisciplined Pursuit of More
The hubris at the top management along with the ballooning cashflow from the core business leads the management to feel that success is assured irrespective of which path they take. In a quest to ‘overreach’ and build an empire of sorts, a company almost always ends up investing in non-core businesses in which it has no competitive advantage. Thanks to a ‘nothing-can-go-wrong’ attitude, acquisitions become the preferred route for venturing into non-core businesses. Financial resources as well as management bandwidth shifts from strengthening the core business to growing the non-core business. This results in fading pricing power in the core business as well and declining RoCEs and free cash flow. External stakeholders can now detect the start of the decline of the company.
3. Denial of Risk and Peril
At this stage, a two-pronged Janus-faced strategy is adopted by the management. For the external stakeholders, cyclical factors are blamed and the poor performance is termed only ‘temporary’ in nature. Loss of market share is explained by dissecting the market, to show market share gains in certain categories and loss in certain categories. Then, strategies are introduced to gain market share in the losing categories. However, internally all is not well. The bureaucratic blame game begins where employees are busy in proving that it was not their fault. Exceptional employees figure out that the company is on the path of decline and start exiting. Their positions are in turn filled by mediocre employees. As the ratio of mediocre employees to exceptional employees grows, the culture of excellence is replaced by a culture of mediocrity.
4. Grasping for Salvation
By now the company has lost most of the competitive advantages in its core business along with its pricing power. As the debt taken to fund acquisitions balloons, vendors decline to supply raw materials on credit. Distributors also demand a longer credit period to pay the company. Exceptional employees leave the company and competition is quick in gaining market share. Profitability erodes leading to declining RoCEs and free cash generation. Shareholders lose their faith in the company leading to massive share price falls.
Stage 4 begins when the company grasps for salvation by ‘biting a silver bullet’. A Superstar CEO is usually recruited positioned as a saviour who will take the company back to its previous glory. The Superstar CEO tries to fire silver bullets by formulating an unconventional strategy, reorganising the company’s management, making a game changing acquisition, undertaking a cultural revolution, etc. However, these measures rarely work in the long term. The silver bullets deplete the company’s resources and increases the pace of its decline.
5a. Capitulation to Irrelevance or Death
After biting enough silver bullets, the company has no competitive advantage in any business. However, it is burdened with massive debt on the balance sheet. After entering the final stage, it only has a few options left: to get acquired by some other company or declare bankruptcy. Equity shareholders see the value of their holding completely wiped out whereas lenders have to take a haircut. Similarly, employees, distributors and vendors also take a blow.
5b. Recovery and Hope
Until the time the company does not go all the way to stage 5, there is still chance to make a comeback. Instead of hiring a Superstar CEO from outside, the company can hire a CEO, preferably an insider, who follows a disciplined approach by getting rid of the non-core assets, shutting down the low-margins businesses and rebuilding operational excellence in its core business. The focus needs to be on cash flow generation, paring down the debt and rebuilding the company gradually over a period of time without trying to fire silver bullets.
Some case studies of Indian companies that have travelled down the Five Stages of Decline
BPL Ltd – Down and out
When colour televisions first came to India in 1982, BPL was quick to sign a technology transfer agreement with Sanyo Electric, once the third largest consumer electronics company in Japan, and set up a plant in India (In 2004, BPL also entered into a JV with Sanyo Electric). By 1990s, company had expanded its consumer durables portfolio into refrigerators, washing machines, lighting and other electrical appliances. BPL was one of the first company to launch a massive advertising campaign in 1994 by roping in Amitabh Bachchan for Rs.8 crores as a brand ambassador. The company soon featured among the top 10 brands in India. By the late 1990s, BPL became one of the largest consumer electronics company in India with every second home using at least one BPL appliance. As a result, from FY94 to FY98, sales increased at 33% CAGR whereas PAT increased at 34% CAGR.
This success gave birth to hubris. BPL used the cash flows of its consumer electronics business and forayed into various other cash guzzling businesses like telecom, alkaline battery business in late 1990s. The focus of the management shifted away from the consumer electronics segment. Korean and Japanese competitors like LG, Samsung, Sony, etc which entered the Indian market in late 1990s, were prompt in launching advanced products like LCD/LED televisions and gain market share. The final nail in the coffin was the deteriorating financial condition of its JV partner Sanyo Electric which led to the dissolution of the JV and the closure of its consumer electronics business in mid-2000s. Over a period of 10 years, from FY99 to FY09, company’s topline shrunk at -27% CAGR whereas PAT turned negative from Rs.103 crores in FY99 to loss of Rs.14 crores in FY09.
(Source: Marcellus Investment Managers, News Article-1, News Article-2, Company filings, Ace Equity)
Ashok Leyland Ltd – Fall and resurrection
Until FY2006, Ashok Leyland ticked all the boxes of a successful company. The company had the ability to allocate capital efficiently along with running its business in a cost-effective manner. During the CV downcycle from FY98 to FY02, Ashok Leyland focused on various cost saving projects and expanded its market coverage. This improvement in systems and processes resulted into accelerated revenue and profitability growth when the industry bounced back from FY03 onwards. Over FY03 to FY06, Ashok Leyland’s standalone revenue increased by a CAGR of 25%, PAT by a CAGR of 33% and RoCE (pre-tax) improved from 13.9% in FY03 to 21.1% in FY06.
However, the company undertook aggressive capex from FY07 onwards to increase capacity by more than 100% along with allocating capital to several non-core businesses. Consequently, Ashok Leyland saw its domestic market share fall from FY07 onwards. Standalone RoCE declined from 25.9% in FY07 to -1.5% in FY14 and Net Debt Equity increased from 0.11x in FY07 to 0.97x in FY14. Negative free cash flow generation was Rs. 1044 crore over FY07-14 period. During this phase, company blamed the cyclicality in the MHCV industry as the culprit and claimed that the loss of market share was a temporary phase.
Fortunately, the company took a few critical steps in the nick of time which prevented this marquee franchise from entering Stage 5a of Jim Collins’ framework described above. Instead of announcing big bang plans, the new CEO Vinod Dasari (internally promoted) and his team followed a disciplined approach for liquidating non-core assets, paring down debt, improving efficiency, reducing the working capital cycle and addressing product/market gaps in the core MHCV business. From being crisis-stricken and debt-ridden in FY14, by FY18 Ashok Leyland’s market share in MHCV increased to 34% (from 26% in FY14), RoCE increased to 30% (from -2% in FY14) and the Company became debt free.
(Source: Marcellus Investment Managers, Company filings, Ace Equity)
Investment Implications
A successful company does not decline overnight. It takes years and sometimes decades for companies to move through all the five stages. However, it is possible, indeed likely, that some of the most successful companies in India may have already entered the path of decline and it may be a matter of time before they enter Stage 5. We at Marcellus know our portfolio companies too can go down the path of decline. In order to detect this at an early stage, we monitor our portfolio companies through two proprietary frameworks: the lethargy test framework and the succession planning framework.
- “Lethargy Test” framework – As highlighted in our July’20 newsletter, the Lethargy Test helps us in spotting portfolio companies that have become lethargic or undisciplined in their capital allocation. This test is conducted by conducting secondary data research (reading annual reports, quarterly management commentary, industry reports, etc.) as well as primary data checks (e.g. extensive discussions with ex-employees, channel partners, raw material vendors, customers, IT and HR consultants).
- “Succession Planning” framework – One of the most common reasons for a successful Indian company sliding is that as the Founder ages and then retires, the franchises atrophies i.e. the franchise follows the biological lifecycle of the Founder. To mitigate this risk, as highlighted in our Aug’20 newsletter, we evaluate our portfolio companies using our succession planning framework, which has the following four parts to it: (i) Evidence of decentralization of power & authority, (ii) Quality and tenure of CXOs in the organization, (iii) Quality and Independence of the Board of directors and (iv) Historical evidence of succession.
What these two frameworks allow us is to improve the odds that our portfolio companies will compound their free cashflows for significantly longer than consensus estimates assume. This “improvement in odds” can have a very powerful impact on the returns generated by our portfolios. For example, if a company is compounding free cashflows currently at 25% and this compounding sustains for the next 5 years (after which it fades to 5% FCF growth a decade hence), a simple DCF model shows that such a franchise would be worth around 24x earnings.
However, if the same company – which is compounding free cashflows currently at 25% – sustains such compounding for the next 15 years (after which it fades to 5% FCF growth a decade hence), fair value for the franchise would be north of ~80x earnings. (For a more detailed working of this example, please refer to our Consistent Compounders newsletter for the month of Jan’20)
Harsh Shah is part of the Investments team at Marcellus Investment Managers (www.marcellus.in)
Disclaimer
Marcellus Investment Managers is regulated by the Securities and Exchange Board of India as a provider of Portfolio Management Services and as an Investment Advisor.
The information provided on this website does not, and is not intended to, constitute investment advice; instead, all information, content, and materials available on this site are for general informational purposes only. Information on this website may not constitute the most up-to-date information. The enclosed material is neither investment research, nor investment advice. Marcellus does not seek payment for or business from this email in any shape or form. The contents and information in this document may include inaccuracies or typographical errors and all liability with respect to actions taken or not taken based on the contents of this site are hereby expressly disclaimed. The content on this website is provided "as is;" no representations are made that the content is error-free.
No reader, user, or browser of this site should act or refrain from acting on the basis of information on this [site/newsletter] without first seeking independent advice in that regard. Use of, and access to, this website or any of the links or resources contained within the site do not create an portfolio manager -client relationship between the reader, user, or browser and website authors, contributors and their respective employers. The views expressed at, or through, this site are those of the individual authors writing in their individual capacities only.