There are four key drivers of free cashflow in a business – revenue growth, profit margins, working capital efficiency, and asset turnover. The order of importance across these four drivers differs across businesses. As Marcellus’ CCP companies invest in technology to improve operational efficiencies, those companies that sell day-to-day essentials to their customers whilst avoiding price hikes, consistently focus on compressing working capital cycles and expanding their asset turnover. For such companies, growth in free cashflows can remain higher than growth in profits sustainably over long time periods. Hence, investment in such companies purely by building expectations around their profit growth is an incomplete exercise.
Performance update – as on 31st October 2021
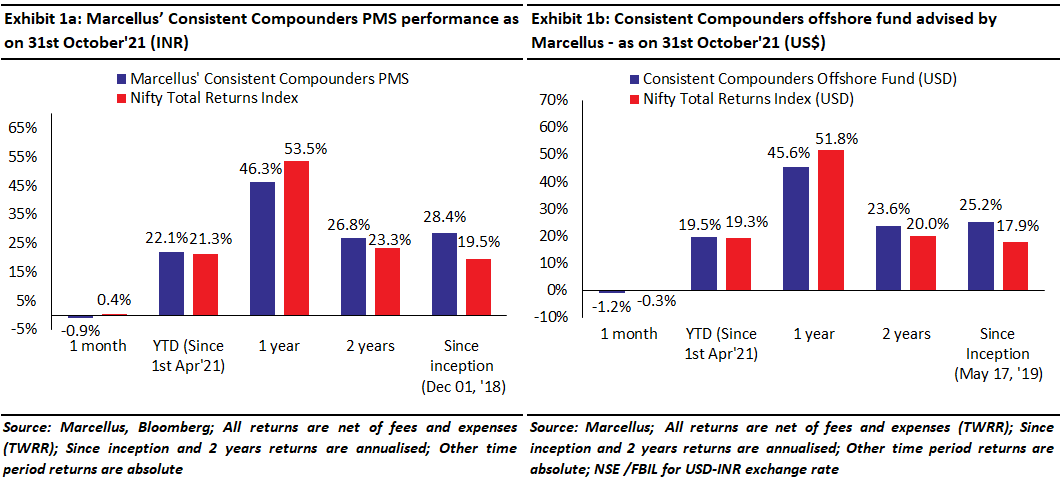
We have a coverage universe of around 25 stocks, which have historically delivered a high degree of consistency in ROCE and revenue growth rates. Our research team of eleven analysts focuses on understanding the reasons why companies in our coverage universe have consistently delivered superior financial performance. Based on this understanding, we construct a concentrated portfolio of companies with an intended average holding period of stocks of 8-10 years or longer. The latest performance of our PMS and offshore fund (USD denominated) portfolios is shown in the charts below.
As the nature of businesses in an industry has evolved, investors need to evolve as well – for instance from focusing on the book value, to focusing on profits, and then from profits to free cashflows.
Valuation of any business is the net present value of all expected free cashflows in future. As a result, for every business, an investor needs to build their expectation of the quantum of growth and the longevity of growth in free cashflows. This is a universal concept that applies to every business.
However, what is not common across businesses is the primary driver of free cashflows (which particularly affects the quantum of growth in free cashflows). Consider the following examples:
Type 1 – Book value as the primary driver of free cashflows: Let’s assume that there is a business which has a unique manufacturing process in a factory that produces a product which meets an essential demand of a large customer base. Furthermore, let’s assume that no competitor can produce a substitute product to meet this customer demand. As the business reinvests capital to expand its manufacturing capacity (plant and machinery), it delivers growth in free cashflows. To invest in such a business, investors must focus on growth in its asset base as the primary driver of its moat and hence free cash flows in the long term. Until half a century ago, investment in many great businesses was carried out on this basis (when P/B multiple was a commonly followed metric).
Type 2 – Profits as the primary driver of free cashflows: Let’s say there is a business which has an exceptionally strong brand recall that cannot be replicated by a competitor. Since there is nothing differentiated about its product quality, the business outsources the entire manufacturing process, and hence it is an ‘asset-light’ business. The primary moat of such a business is its ‘brand’. At the simplest level, the more this business advertises its brand across various media channels, the more it delivers volume growth, revenue growth and hence profits growth. Investing in such a business requires focus on only the ‘Profit and Loss’ statement – how much of profits from a given year get reinvested in advertising next year. Over the last 40 years, as penetration of mass media increased across countries, there were several such great businesses. It is not worth considering the P/B multiple for such a business – its P/B multiple will keep rising as the business grows (because the business is outsourcing its “B”). Instead, P/E multiple is more relevant for such a business.
Here is an interesting comparison of two different businesses from the same industry on P/B multiples – Proctor and Gamble (the parent listed in the US) and Colgate Palmolive (the parent listed in the US). P&G has grown its business through numerous acquisitions. These acquisitions have brought significant goodwill on to its balance sheet. On the other hand, Colgate-Palmolive has a negative accounting book value because its most valuable assets are the brands it has developed in-house over its hundred plus years of existence. Hence, P&G looks cheaper based on P/B multiple compared to Colgate (because the denominator is much bigger in the case of P&G). The two companies are in the same industry, but given the differences in their capital allocation approach, one looks significantly cheaper than the other on P/B multiple and that highlights the irrelevance of P/B.
Let’s now move forward another step to see businesses have which evolved even further and thus made the P/E multiple irrelevant. Let’s understand this more through a third type of business.
Type 3 – Operating efficiencies as a key driver of free cashflows: What if a business significantly reduces its working capital cycle and increases its asset turnover through a variety of initiatives, consistently over the next 20 years? Let’s assume that such a business also sustains high pricing power (and hence profitability on the income statement) and healthy rate of capital reinvestment. In such a case, the rate of growth in free cashflow will far exceed, both the rate of growth in its profits, as well as the rate increase in its net assets, due to the reduction in working capital cycles and increase in asset turnover. Investing in such a business requires focus on free cashflows (rather than just growth in net assets or growth in profits). If the rate of growth in free cashflows of such a business remains higher than the rate of growth in earnings, then comparison of this business with a Type 2 competitor (as described above) on P/E multiple is flawed. In other words, the P/E of such a business will keep rising as long as the free cashflow growth of the business remains above earnings growth.
Hence, in equity investing, it is worth understanding the source of free cashflow growth of your investee company (metrics on balance sheet vs income statement vs cashflow statement) in order to focus on the most relevant financial metric and hence a valuation approach.
Three reasons why investors should focus only on Free Cashflows in the case of Consistent Compounders
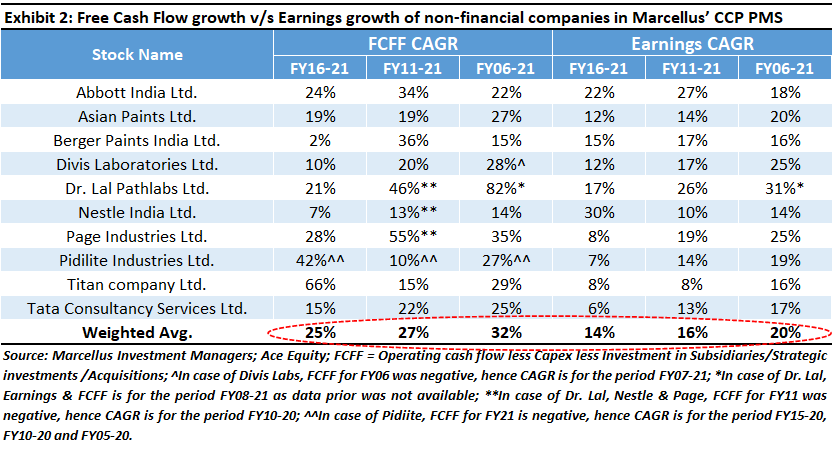
In Marcellus’ Consistent Compounders Portfolio, there are several companies whose growth in free cashflows tends to be far greater than the growth in their profits. As shown in the exhibit below, FCFF CAGR of our portfolio companies (ex-Financials) has been 11-12% points higher than the earnings CAGR consistently over the past 5/10/15 years. As a result, investors focusing on only the income statement or profits of these companies often get an incomplete understanding of their competitive advantages and hence valuations.
A combination of the following three reasons makes most companies in Marcellus’ Consistent Compounders portfolio akin to Type 3 companies defined above.
- Focus on in-house manufacturing and distribution of products and services which are of day-to-day essentials: Our portfolio companies sell essential products and services such as pathology diagnostics, infant milk powder, undergarments for daily wear, OTC medication for daily consumption, etc. The small ticket sizes of these essential offerings orient their businesses towards large volumes of sales. Distribution of small-ticket high-volume products to every nook and corner of India gives rise to complexities around management of inventory, receivables as well as payables in the supply chain. Additionally, even though these companies have the option to outsource manufacturing at the back end and distribution at the front end, most of them have chosen to keep these functions in-house. For example Nestle manufactures most of its product at its own factories. Page Industries is the only apparel manufacturer which employs its entire labor workforce on their payrolls, does not rely on wholesale-oriented distribution and also owns all fixed assets related to their manufacturing plants. Asian Paints directly sells its products to paint dealers on the high street, without any involvement of distributors or wholesalers and also manufactures all its products at its own manufacturing plants. Due to in-house manufacturing and distribution of small-ticket high-volume products and services, our portfolio companies have a massive opportunity for deriving operating efficiencies around working capital cycles and asset turns.
- Lack of price hikes to suffocate competition: In our 1st June 2020 newsletter (CCPs avoid price hikes to strengthen pricing power) we had highlighted that firms in Marcellus’ CCP Portfolio – like Asian Paints, Abbott India, Dr. Lal Pathlabs – have historically avoided hiking product prices meaningfully. This is because by focusing more on volume of sales (rather than value), these companies do not intend to leave any room for their competitors to start any price wars to gain market share. Such firms consistently derive incremental operating efficiencies through investments in technology, systems and processes. These operating efficiencies help offset the adverse effect of inflation in raw material and operating cost, and hence negate the basic need to hike product prices. If competitors cannot match the quantum of such incremental operating efficiencies, they get suffocated because of lack of price hikes from the market leading player.
- Investments in technology to derive operating efficiencies which further strengthen their moats: There are several technology based ingredients of competitive advantages of our portfolio companies which drive a greater rate of free cashflow growth compared to profit growth. For example, superior understanding of the end consumers’ demand and preferences helps the manufacturer reduce dead inventory in its supply chain / distribution channel and convert working capital into cash much quicker compared to the competition. A faster cash conversion cycle then helps the manufacturer to carry out activities such as making quicker payments to raw material vendors and avoiding price hikes despite generating high returns on capital employed. Moreover, there exists immense scope for deriving operating efficiencies through initiatives such as the use of technology to automate manufacturing processes, reduce cycle times, derive raw material procurement efficiencies, to sweat the fixed assets harder.
Most of the tech investment related competitive advantages are difficult for competitors to replicate, either because they are based on proprietary data, or because they were done over a period of time as part of the DNA of the organization, rather than investments that were done at a single point of time in the past.
Examples of how Marcellus’ CCP portfolio companies have consistently focused on free cashflows oriented initiatives
Following are some examples of how Marcellus’ CCP companies have compounded their free cashflows faster than profit growth through improvement in operating margins, compression of working capital cycles, and improvement in asset turns.
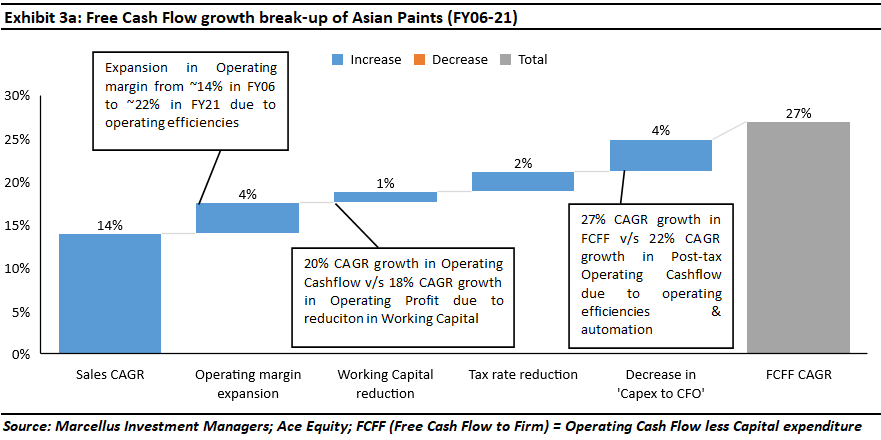
Asian Paints: Asian Paints has consistently used demand forecasting and data analytics to improve its supply chain efficiencies. As a result, the firm saw a reduction in its working capital cycle from over ~100 days in FY95 to ~10 days by FY10. Moreover, Asian Paints’ annual reports over the past 20 years have consistent talked about its focus improve fixed asset turns by sweating its assets harder before it decides to expand its manufacturing capacity. For example, the FY04 annual report states “Company’s last greenfield paints manufacturing facility was set up in 1990. Over the last few years, Asian Paints has been following a deliberate strategy of postponing capital expenditure for primary production facilities. This has been possible, as we have focused on enhancing productivity of existing assets and improving plant efficiencies to realise higher production levels from existing plant and machinery, quick and effective standardization of processes, implementation of the concept ‘Right First Time (RFT)’, 5S and RCA (problem solving through Root Cause Analysis) are some initiatives undertaken by the company that have allowed existing manufacturing facilities to produce more from the same assets”. As the complexity of manufacturing increased with increasing number of SKUs, plants and warehouses set-up after FY09 were fully automated leading to better scalability, lower wastage, and stronger environmental compliance. As a result, Asian Paints’ asset turns (measured by Gross profit divided by Gross block) improved from ~1.4x in FY00 to ~1.8x in FY07 to ~2.1x in FY17.
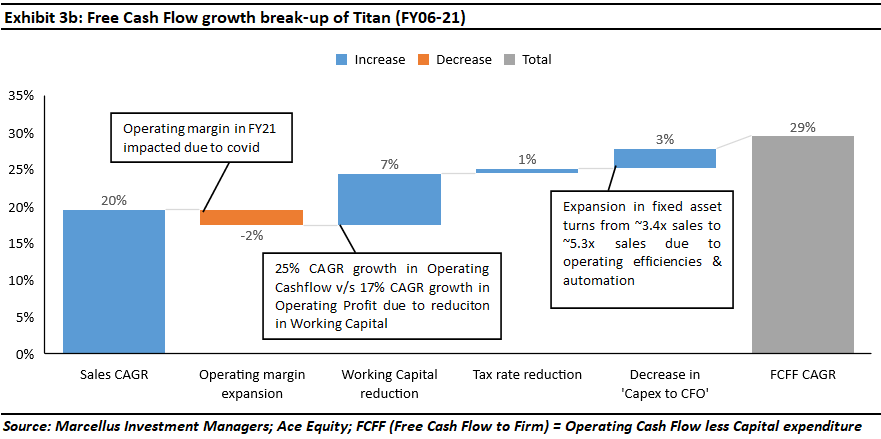
Titan: In India, all jewellers outsource manufacturing of gold jewellery to the karigar (goldsmith) community which is highly unorganised and marked with outdated practices/technologies of manufacturing along with poor work conditions. The resulting challenge is inefficient supply chain in form of higher wastage, high manufacturing lead times leading to high investment in RM/WIP inventory of high value commodity like gold. Titan radically disrupted the status quo starting with basics by engaging with karigars to upgrade their working conditions by providing health benefits, financing procurement of modern equipments and investing in land & building for four ‘karigar centers’ designed to improve lifestyle of karigars. Moreover, once the basics were addressed, Titan worked with Karigar’s to train them around efficient practices like Theory of Constraints and Lean Manufacturing, resulting in significant improvements in manufacturing efficiency. As a result, over a period of FY05-FY11, manufacturing lead time at vendors reduced from ~35 days to ~6 days, effectively reducing WIP inventory at vendors by one sixth and improved Titan’s ability to offer faster turnaround times and improved stock availability to its customers. While most of the plain gold jewellery manufacturing is outsourced to karigars, bulk of Titan’s diamond jewellery products are manufactured in-house where Titan used robotics to automate mannual processes which has improved capacity by 10x over FY05-11 and has freed up hundreds of man-days of its workers.
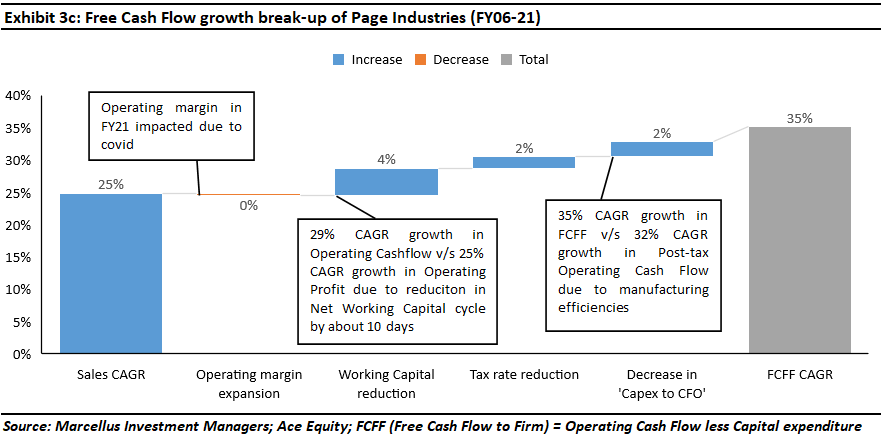
Page Industries: On the manufacturing front, Page’s moats include product differentiation in the form of quality, consistency & comfort derived from in-house manufacturing. Executing in-house manufacturing of Page’s products at scale is challenging because the process is highly labour intensive. Page’s approach to improve & sustain higher asset turns has been three-fold: (a) managing labour relations better than competitors to improve retention rates of well-trained workforce; and (b) use of automated machines for processes such as fabric inspection, fabric cutting etc to improve productivity; (c) use of technology to monitor labour efficiency (e.g. use of RFID/proximity cards to capture real time data). As a result, over FY08-18, Page’s asset turns improved from ~3.8x to ~6.5x. Also, over FY13-18, Page reported a 6% CAGR in the volume of products sold per unit labour workforce. On the working capital front, ready availability of large number of SKUs across ~80,000 points of sale across the country is another key moat of Page’s business. However, the key challenge here is managing the complexity in supply chain due to a large number of SKUs, without compromising on inventory turns (thereby avoiding loss of sales). Moreover, the complexity of Page’ supply chain has increased over time due to the launch of new SKUs and increasing focus on adjacencies like womens innerwear (which has by itself has a wider range of SKUs vs mens innerwear), athleisure/outerwear and more recently kidswear. To overcome this challenge, Page has made significant tech investments around sales force automation to capture granular sales data, data analytics for demand forecasting and supply chain tools like ‘BlueYonder’ for better planning. As a result, despite increasing complexity due to more SKUs, Page’s inventory days have reduced from around ~100 days to ~85-90 days over the last 10 years.
Investment implications – Free Cashflows forecasting requires far more research (vs profits or book value forecasting) There are four possible drivers of free cashflows of a firm: Volume growth or revenue growth; Operating margins or profit growth; Reduction in working capital cycles or operating cashflow growth; or Increase in asset turnover or free cashflow growth. When it comes to high quality companies, investors who have focused only on volume growth and profit growth (or only P/E multiples) and have ignored the other two factors, have only partially been able to understand the long term compounding ability of these companies. Having said that, building an understanding around working capital cycles and asset turnover prospects is far harder than understanding a company’s earnings growth prospect for two key reasons. Firstly, it requires greater depth of research around the business’s operating efficiencies. And secondly, it requires a greater degree of patience from an investor, because free cashflow can be far more volatile in the short term compared to profits or book value per share. Changes made to Marcellus’ CCP portfolio: Tata Consultancy Services (TCS) has been part of some of Marcellus’ portfolio for the last two years. Work done by our analysts more recently on this company has led to an upgrade to our expectations of the rate of growth in the fundamentals of TCS, as highlighted below. Due to this upgrade in our expectations, we have included TCS in Marcellus’ CCP Portfolio as well. However, given our approach of maintaining an optimum level of concentration in the portfolio (click here to understand our views on portfolio concentration), we have replaced Relaxo Footwears with TCS, rather than increasing the list of stocks in the portfolio due to the addition of TCS. There has been no change in our conviction levels on Relaxo Footwears over the past few months. Relaxo continues to be part of several other Marcellus portfolios. TCS investment hypothesis: One of the biggest drivers of growth for Indian IT Services over the last 3-4 years has been the migration from on-premise data centres to the cloud. Covid-19 pandemic has accelerated this migration as institutions and corporates require data to be accessed from anywhere, any time by a large number of users, something that is not so seamless under the old IT architecture. Furthermore, once IT applications are moved to the cloud, there are multiple opportunities that open up in digitalising the information and utilising it for multiple business functions. Most of these opportunities are in data analysis, digital marketing, AI and ML, etc. Such opportunities will likely provide a long tail to the cloud migration opportunity that is currently underway. Effective migration from the old tech architecture to the new one is likely to lead to an acceleration in three aspects of the IT services industry: (1) IT vendor consolidation with corporates preferring vendors who can provide such skillsets at a large scale; (2) penetration into new areas outside the CIO’s domain, such as marketing and manufacturing; and (3) market share gains for firms which can lead captive takeovers, as clients focusing on cost reduction look to offload non-core operations to reduce operating expenditure. TCS is best placed to benefit from the evolution of the industry around these three aspects due to its following competitive advantages: TCS’ ability to hire, train and deploy talent at scale – TCS has been significantly ahead of the curve in these aspects of its business relative to competition. With rising number of freshers being hired, the company moved its campus recruitment program online and now invites applications through a National Qualifier Test. This process has multiple benefits – from removing the limitation of physically visiting campuses, they now have access to graduates from across the country. Plus, an online test helps identify specific skillsets, and helps in matching new hires directly with potential roles. On the training front, TCS was one of the early players to recognise the importance of training fresh graduates and had started planning for a training campus in Trivandrum way back in 1993 and accepted the first batch in 1997 – for context, Infosys’ Mysore training campus started in 2002. TCS then digitalised its training programs as far back as the early 2000s, making it accessible to employees anytime and anywhere. Learning and training today is a continuous process at TCS. Early investments in these initiatives has enabled TCS to grow to a 500,000+ people company, which in turn allows it to undertake larger projects vs its competitors Investing in IP – TCS has had a history of encouraging innovation within the company and providing employees with avenues of filing patents for the research they carry out. On a cumulative basis, TCS has applied for 5,879 patents and has been granted 1,850 (as of March 2021). This includes 663 patents filed and 509 granted in FY21– the highest ever tally in a single year. A key advantage of fostering innovation is the creation of platforms and products that drive non-linear profit growth. The company has products and platforms in the BFSI space, retail, medical trials, blockchain etc. which, over time, will drive margin expansion. HR policies drive low attrition – The training and learning infrastructure at TCS is combined with initiatives that allow flexibility to people to move vertically as well as horizontally. Our primary research on TCS indicates that employees are encouraged to train themselves in newer technologies and coding languages that enable them to remain relevant in an industry where rapid changes in the operating environment are the norm. The access to the training as well as the internal opportunities to do justice to the training through career progression is a key retention incentive that TCS has built. At senior levels, the scope of responsibilities and autonomy are the key incentives. The company operates with about 150 verticals and sub-verticals, each headed by a person with P&L responsibilities. For some of the larger verticals, the business head is effectively running a division that is larger than many IT companies. The opportunity to grow within the company is a strong incentive to continue in the job. Other benefits, like the assurance of not being laid off, the ability to work in a centre closer to home (TCS has the most widespread development centres) etc. also combine to make TCS the IT services company with the lowest attrition rates (~8-10% vs ~15% for peers) in the industry. Lower attrition means lesser costs of hiring, training, and retraining, which have a direct impact on the firm’s profitability. In fact, in the current talent supply crunch environment, the benefits of low attrition rates become more distinctive. The stability at the top level also drives strong comfort on succession planning. The median time spent by the C-Suite with TCS is 20 years and in its history of 50+ years, they have had just 4 CEOS – all internally selected and groomed.
Regards
Team Marcellus
Disclaimer
Marcellus Investment Managers is regulated by the Securities and Exchange Board of India as a provider of Portfolio Management Services and as an Investment Advisor.
The information provided on this Newsletter does not, and is not intended to, constitute investment advice; instead, all information, content, and materials available on this newsletter are for general informational purposes only. Information on this website may not constitute the most up-to-date information. The enclosed material is neither investment research, nor investment advice. The contents and information in this document may include inaccuracies or typographical errors and all liability with respect to actions taken or not taken based on the contents of this Newsletter are hereby expressly disclaimed. The content on this Newsletter is provided "as is;" no representations are made that the content is error-free.
No reader, user, or browser of this Newsletter should act or refrain from acting on the basis of information on this Newsletter without first seeking independent advice in that regard. Use of, and access to, this website or any of the links or resources contained within the site do not create an portfolio manager -client relationship between the reader, user, or browser and website authors, contributors and their respective employers. The views expressed at, or through, this site are those of the individual authors writing in their individual capacities only.
