Many investors try to time their investments basis the perceived impact of external events on either thebroader stock market or on the share prices of specific firms. Analysing the last 30 years of stock marketdata suggests that even if an investor were to perfectly time her investments in indices / good companieseach year, her returns would not be significantly higher than other investors who randomly time theirinvestments.
“I can’t recall ever once having seen the name of a market timer on Forbes’ annual list of the richest people in the world. If it were truly possible to predict corrections, you’d think somebody would have made billions by doing it.” – Peter Lynch
In this months’ newsletter, we analyse this statement from Peter Lynch. Assume we have two investors – both of whom invest Rs. 1 crore annually in shares of Asian Paints from their annual savings. The first investor is Mr. Gifted. He is skilled at timing share prices. Each year, he buys Rs 1 crore worth of Asian Paints shares at the lowest price point of that year. The second investor is Mr. Mortal. He believes he cannot time share price movements, and hence he buys Rs 1 crore worth of Asian Paints shares on the 1st January of each year,regardless of the prevailing share price.
Mr. Gifted and Mr. Mortal start investing in Asian Paints from 2008 onwards.
In their first year of investing, Mr. Mortal invests Rs 1 crore in Asian Paints at Rs 113.6 per share on 1st January 2008. However, Mr. Gifted uses his skills, waits for Asian Paints’ share price to fall to its lowest level for the year – Rs 85.3 per share on 15th December 2008 – and hence invests his Rs 1 crore at a 25% lower share price vs Mr. Gifted, on their 2008 investment.
Something similar transpires in the second year of investing – Mr. Mortal invests Rs 1 crore in Asian Paints at Rs 88.8 per share on 1st January 2009. However, Mr. Gifted uses his skills, waits for Asian Paints’ share price to fall to its lowest level for the year – Rs 71.0 per share on 12th March 2009 – and hence invests his Rs 1 crore at a 20% lower share price vs Mr. Gifted, on their 2009 investment.
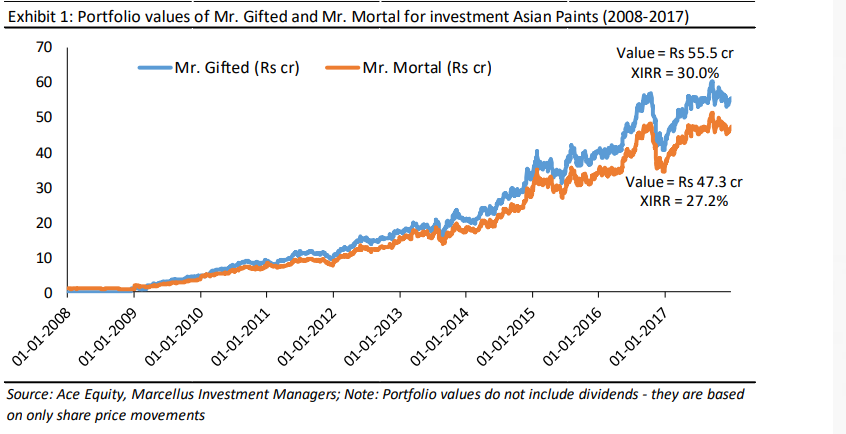
The two investors follow this process annually for the next 10 years. At the end of 10 years, on 31st December 2017, the two investors compare their portfolio values and XIRR (annualised rate of return).
Mr. Gifted’s portfolio is worth Rs 55.5 crores, an XIRR of 30.0%!
Mr. Mortal’s portfolio is worth Rs 47.3 crores, an XIRR of 27.2%!
Mr. Mortal’s portfolio value is only 15% lower than that of Mr. Gifted!! Whilst that is a meaningful premium, it is not as high a premium as many imagine market timers to command. The chart below shows the progression of their portfolio values during the 10 years investment period. Note: These portfolio values DO NOT include dividends – they are based only on share price movements. Including Dividends will increase the XIRR numbers by 1-2% for both investors.

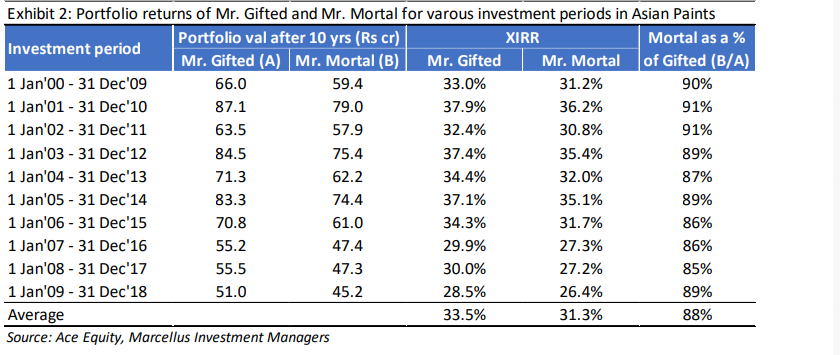
Moreover, this was not the only 10-year period when Mr. Gifted failed to add much value via his skills of timing
his annual investments into Asian Paints share price. The table below shows that no matter when the two investors started this exercise, Mr. Mortal ended by being only 12% less wealthy than Mr. Gifted at the end of their 10 year investment.

Other variants of this analysis
• If we consider investing in the Sensex (instead of Asian Paints) over any 10 year time period after 1991,
the outcome would not have been dissimilar. Mr. Mortal’s 10 year portfolio value would have been
80-90% (average of 82%) of Mr. Gifted’s portfolio value.
• If we increase the time frame of investment of each portfolio from 10 years to 20 years for any year
after 1991, the outcome would still be the same! Mr. Mortal’s 20 year portfolio value would have been
on average 82% of Mr. Gifted’s portfolio value if invested in Sensex, and an average of 84% if invested
in Asian Paints.
Why does this happen?
The simple reason why Mr. Mortal isn’t too far behind Mr. Gifted in all these portfolio iterations discussed above is that – Earnings drive 80-90% (if not higher) of the stock returns generated over the long run. As a result, provided the underlying asset (company or an index) delivers a modest or healthy earnings growth, it does not matter whether the entry point of one investor was 20% higher or lower than another investor.
Investment implications for markets in general and Consistent Compounders in particular
Most investors have recurring cash flows to invest each year. However, too many people spend a lot of effort trying to be Mr. Gifted. For instance, several investors in India are trying to time their investment in the stock market in 2019, basis their expected outcome of events such as the general elections in India or tensions between India and Pakistan. However, not only is it difficult being Mr. Gifted in market timing, it is also not worth the effort.
The philosophy we follow for Consistent Compounders PMS aims at investing in companies whose earnings, believe, will compound consistently at 20-25% over long periods of time. Instead of worrying about howbest we can time the market volatility and entry valuations for these investments, we spend all our efforts trying to understand and build high conviction on their fundamental strengths which are likely to drive their earnings in future.
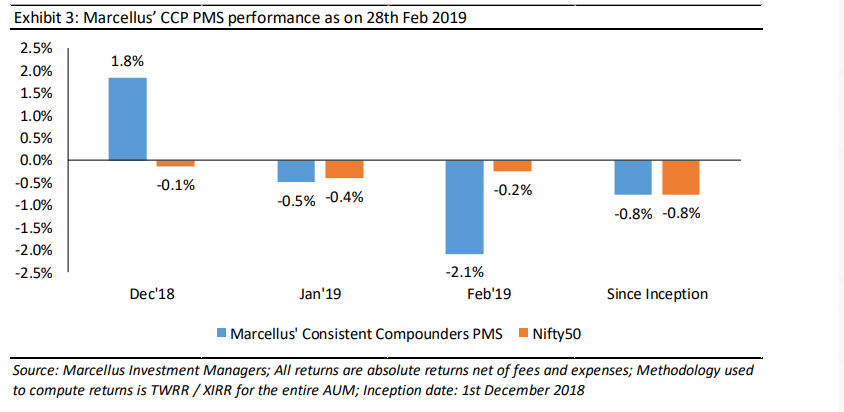
Performance update – Marcellus’ Consistent Compounders PMS – as on 28th February 2019
Given the longevity of fundamentals of our portfolio companies, we don’t expect the portfolio to churn more than one stock per year on an average (i.e., no more than 5-10% expected average churn).

Regards
Team Marcellus
If you want to read our other published material, please visit https://marcellus.in/resources/
Note: the above material is neither investment research, nor investment advice. Marcellus does not seek payment for or business from this email in any shape or form. Marcellus Investment Managers is regulated by the Securities and Exchange Board of India as a provider of Portfolio Management Services and as an Investment Advisor.
Copyright © 2018 Marcellus Investment Managers Pvt Ltd, All rights reserved.
This communication is confidential and privileged and is directed to and for the use of the addressee only. The
recipient if not the addressee should not use this message if erroneously received, and access and use of this e-mail in any manner by anyone other than the addressee is unauthorized. If you are not the intended recipient, please notify the sender by return email and immediately destroy all copies of this message and any attachments and delete it from your computer system, permanently. Any opinions or advice contained in this email are subject to the terms and conditions expressed in a duly executed contract or written agreement between Marcellus Investment Managers Private Limited and the intended recipient. No liability whatsoever is assumed by the sender as a result of the recipient or any other person relying upon the opinion unless otherwise agreed in writing. The recipient acknowledges that Marcellus Investment Managers Private Limited may be unable to exercise control or ensure or guarantee the integrity of the text of the email message and the text is not warranted as to its completeness and accuracy.
Disclaimer
Marcellus Investment Managers is regulated by the Securities and Exchange Board of India as a provider of Portfolio Management Services and as an Investment Advisor.
The information provided on this Newsletter does not, and is not intended to, constitute investment advice; instead, all information, content, and materials available on this newsletter are for general informational purposes only. Information on this website may not constitute the most up-to-date information. The enclosed material is neither investment research, nor investment advice. The contents and information in this document may include inaccuracies or typographical errors and all liability with respect to actions taken or not taken based on the contents of this Newsletter are hereby expressly disclaimed. The content on this Newsletter is provided "as is;" no representations are made that the content is error-free.
No reader, user, or browser of this Newsletter should act or refrain from acting on the basis of information on this Newsletter without first seeking independent advice in that regard. Use of, and access to, this website or any of the links or resources contained within the site do not create an portfolio manager -client relationship between the reader, user, or browser and website authors, contributors and their respective employers. The views expressed at, or through, this site are those of the individual authors writing in their individual capacities only.

