Marcellus’ CCP companies grew their revenues in 3QFY22 (vs 3QFY20) at 19% CAGR. This is significantly higher than: a) the 17% revenue growth reported over FY14-19 (i.e. prior to Covid-19); and b) the 16% revenue CAGR that was reported in 2QFY22 (vs 2QFY20). The drivers of this acceleration can be categorized into two types. Firstly, market share gains by the CCP companies due to their superior response to the uncertainties presented by the pandemic over the past two years. And secondly, capital allocation initiatives implemented over the last two years by CCP companies to deepen their existing moats, add new growth drivers, and radically disrupt the industries in which these companies operate. The recent input cost inflation is yet another opportunity for CCP companies to strengthen their competitive advantages.
Performance update – as on 28th February 2022
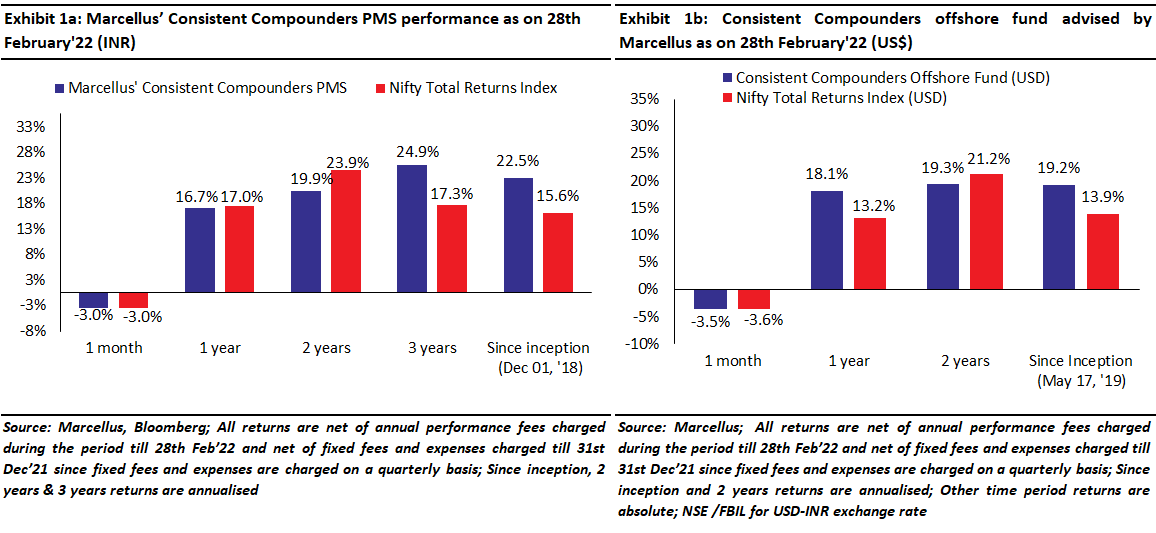
We have a coverage universe of around 25 stocks, which have historically delivered a high degree of consistency in ROCE and revenue growth rates. Our research team focuses on understanding the reasons why companies in our coverage universe have consistently delivered superior financial performance. Based on this understanding, we construct a concentrated portfolio of companies with an intended average holding period of stocks of 8-10 years or longer. The latest performance of our PMS and offshore fund (USD denominated) portfolios is shown in the charts below.
Acceleration in fundamentals of CCP companies in the recent quarters
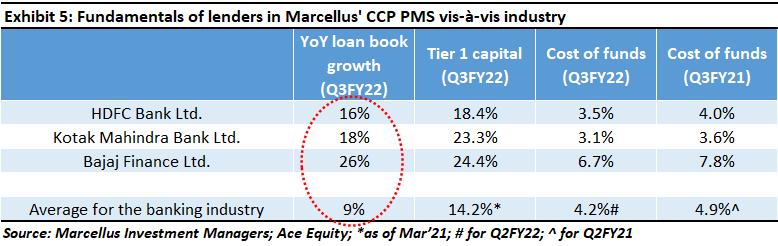
During 3QFY22 (i.e. the quarter ending December 2021), revenues of our portfolio companies compounded at 19% CAGR over the past two years (i.e. compared to the pre-Covid quarter ending December 2019). This includes 21% revenue CAGR for the non-lending stocks in the portfolio and 13% CAGR for the lenders in the portfolio (i.e. banks and NBFCs). Whilst the 2-year CAGR for loan book growth for the three lenders – HDFC Bank, Bajaj Finance and Kotak Bank – has been only 13%, they reported a sequential annualised loan book growth of 32% in 3QFY22! – see Exhibit 2 below.
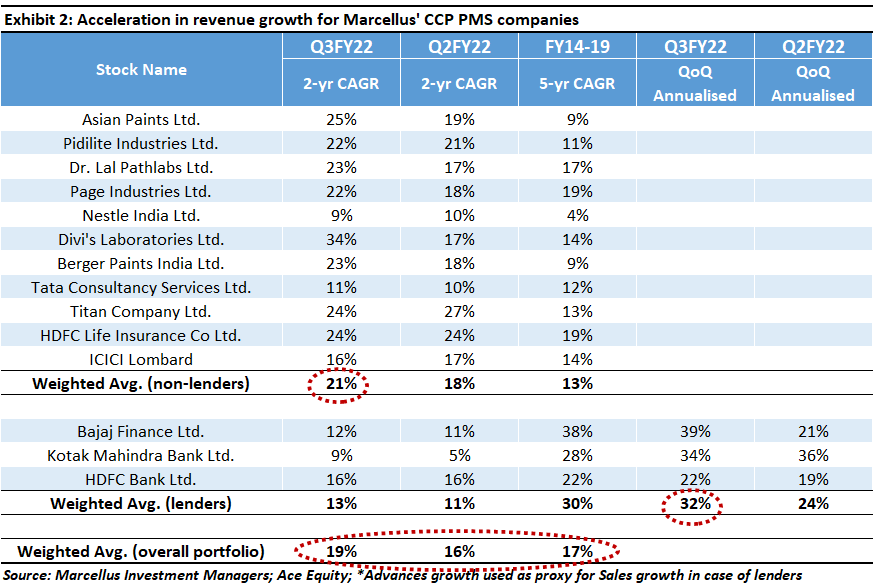
These rates of growth have significantly accelerated compared to 2QFY22 (i.e. the quarter ending September 2021) as well as compared to the years prior to Covid-19 pandemic (i.e. FY15-19).
Why are CCP companies witnessing an acceleration in the growth of their fundamentals?
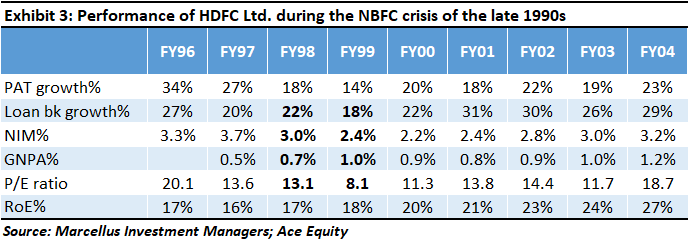
In our 1st November 2019 newsletter titled ‘The Lenders In Our Portfolio Will Gain From The Ongoing Crisis’, we had highlighted how “Great lenders (banks as well as NBFCs), which are Consistent Compounders, benefit significantly in the aftermath of a financial crisis. This is because: (a) when the competition struggles to raise funds during & after a crisis, great lenders have access to adequate liquidity; and (b) as competition’s ability to lend reduces, great lenders can pick and choose quality borrowers, leading to better net interest margins (NIMs), higher loan book growth, lower NPAs and hence better RoEs.”
For instance, the 1990s saw fraudulent behaviour by large NBFCs, changed regulations, and eventually a shakeout in the NBFC sector. Subsequently, as the RBI tightened NBFC regulations, the number of NBFCs dropped to 7,855 in March, 1999 from 55,995 in March, 1995 i.e. over 80% of the NBFCs were shut down.
Exhibit 3 below shows how HDFC Ltd’s growth in PAT and loan book moderated in FY99. However, after the crisis, HDFC Ltd’s loan book growth accelerated from 18% in FY99 to 31% in FY01 and 30% in FY02, and its ROE went up to 27% by FY04 from 16-17% ROEs prior to the crisis.
History may not repeat itself, but it does rhyme. There are two main drivers of acceleration in the rate of growth of CCP companies’ fundamentals in 3QFY22, that we had highlighted in Exhibit 2 above –
1. Market share gains as competitors got crippled: The logistical challenges posed by Covid-19 related lockdowns over the past two years had a severe adverse impact on unorganised players in various industries such paints, adhesives, diagnostics, jewellery retail, etc. Even amongst organised players, the superiority of systems and processes of CCP companies helped them deal with various stakeholders (employees, vendors, distributors and customers) with greater agility compared to their weaker organised competitors over the past two years.
2. Capital allocation initiatives implemented over the last two years: Several CCP companies accelerated capital allocation initiatives which deepen their existing competitive advantages, add new revenue growth drivers, and attempt to radically disrupt their industry’s future, thereby adding to the sustainability of their business’ competitive advantages. Here are some examples of such capital allocation initiatives (all of which took place whilst Covid-19 hammered our investee companies’ competitors):
a. Dr. Lal Pathlabs – Acquisition of Suburban Diagnostics and setup of reference laboratories in Bangalore and Mumbai to help expand the firm’s footprint in west and south India.
b. Pidilite – Acquisition of Araldite from Huntsman to take leadership control of the epoxy adhesives industry.
c. Asian Paints – Acceleration in investments behind home décor as a service over the last two years, in addition to sanitisation and express painting services. Home improvements businesses have turned profitable, and the firm expects home décor to contribute to more than 17-18% of business for Asian Paints at GMV level by FY25.
d. Titan – Strengthening of its wedding jewellery offerings which has led to a multi-fold increase in its contribution to more than 20% of total revenues for the firm currently (previously a weak part of Titan’s jewellery offerings). Caratlane as a new concept has seen rapid adoption by customers through the Covid-19 pandemic, and hence significant investments have been implemented behind growing the share of Caratlane to above 4.5% of Titan’s overall revenues.
e. Dr. Lal Pathlabs – Investments into home sample collection infrastructure in tier 2 and 3 cities where acceptance of ‘home sample collection’ as a concept was weak prior to Covid-19 pandemic and increased significantly over the last two years. The firm has also intensified its efforts to get into partnerships with mom-and-pop labs in newer geographies for expansion of their hub and spoke network of labs by offering longer list of tests, faster turnaround times and the stronger brand recall of Dr. Lal Pathlabs to such partners.
f. Bajaj Finance – BAF’s business transformation 2.0 is likely to be one of the most radical transformations for an Indian listed company with the key theme being to create an app based omni-channel ecosystem which will provide flexibility to customers to move online to offline and vice versa in a frictionless manner. Transformation 2.0 will enable BAF to not only double its existing customer base but also mine the wallet share of its existing customers in a cost-effective manner. We had explained this in greater detail in our July 2021 KCP newsletter.
g. Page Industries – Automation of its front-end supply chain infrastructure through systems such as ARS (auto replenishment systems) and BlueYonder ERP tool for improving demand forecasting, customer responsiveness, fulfillment, and inventory optimization. Digital factory initiative in the Hassan facility to get real time data on key manufacturing activities like skill deployment, WIP management, efficiency tracking, online inventory management, down time tracking etc.
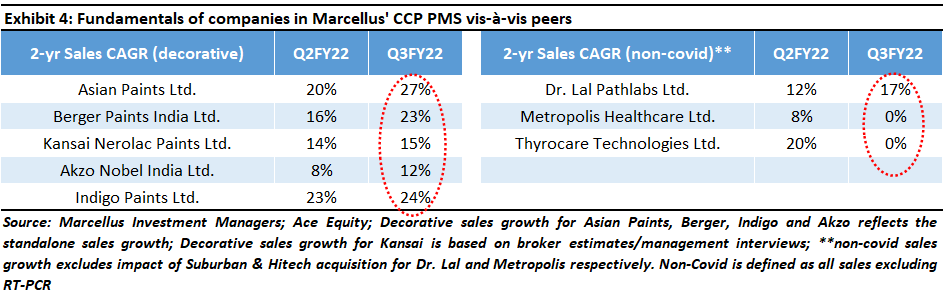
As a result of these initiatives, the gap between growth rates of our portfolio companies’ revenues and their listed competitors has significantly widened over the past few years, as can be seen in the exhibits below.
Recent input cost inflation is another opportunity to strengthen competitive advantages of CCP companies
The classical definition of high pricing power of a company is its ability to protect margins by hiking product prices amidst raw material cost inflation, whilst also maintaining the demand for its products. Marcellus’ CCP companies possess a very high degree of pricing power, due to which their margins stay protected in the face of significant volatility in input costs, as highlighted in the exhibit below.
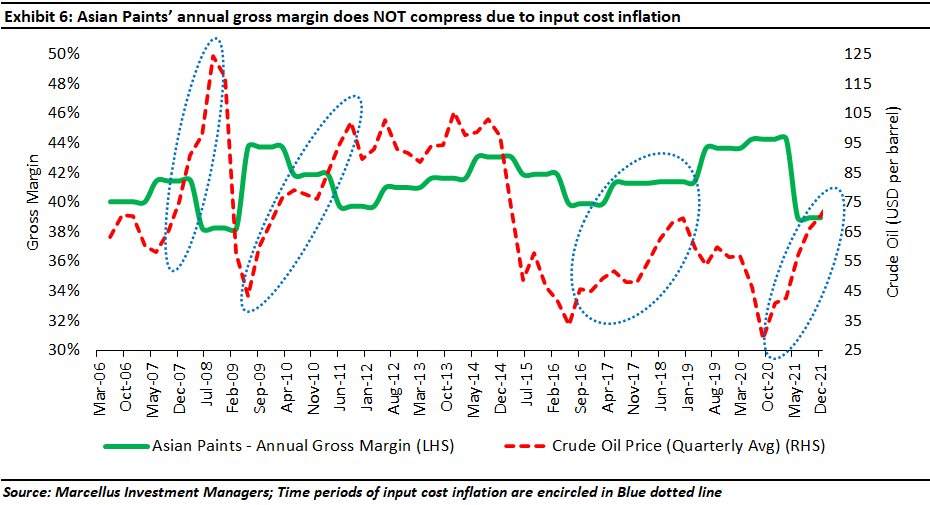
More importantly, our portfolio companies use input costs to their advantage through their intense focus on deriving incremental operating efficiencies to support their profit margins. These operating efficiencies partially negate the need to hike product prices, which in turn puts incremental pressure on the competitors of our portfolio companies which are unable to derive similar operating efficiencies in their businesses. We had explained this attribute of our portfolio companies in greater in our 1st June 2020 newsletter titled ‘CCPs avoid price hikes to strengthen pricing power’.
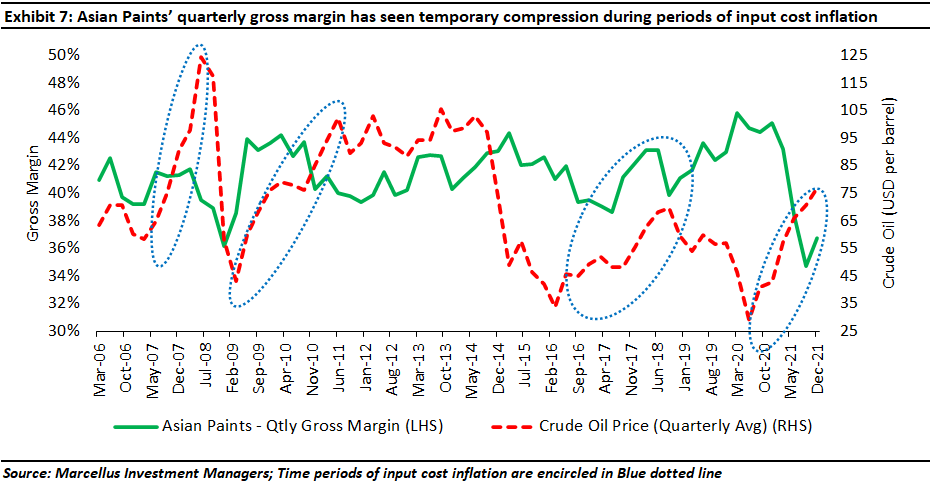
The impact of this approach is that although, as highlighted in Exhibit 6 above, the annual gross margins of our portfolio companies remain unaffected by input cost inflation, their quarterly gross margins do undergo volatility due to volatility in input costs – see Exhibit 7 below.
Investment implications
As Winston Churchill was working to form the United Nations after World War II, he famously said, “Never let a good crisis go to waste”.
Marcellus’ CCP portfolio companies have massively benefitted from the uncertainties and challenges they faced over the last two years, including logistical challenges, business transformation related capital allocation initiatives, and the ongoing inflation in inputs costs for key raw materials. As a result of these benefits, revenue growth rates of our portfolio companies have been higher than those reported over FY14-19 and these growth rates are accelerating sequentially from one quarter to the next quarter. Moreover, such benefits also help increase the longevity of growth in fundamentals of our portfolio companies, which ends up being the biggest source of undervaluation that we try to benefit from in our portfolio.
Recent changes made to the CCP portfolio
Abbott India has been replaced with ICICI Lombard in our CCP portfolio recently. This change has been implemented due to a downgrade in the fundamental scores of Abbott India in our research framework because of the following factors:
- Weakening of competitive advantages in certain key products: Abbott India has lost significant market share in many products with the biggest market share loss being in its erstwhile monopoly molecule Duphaston (loss of 30 percentage points market share in value terms in last two years after launch of a competing product by Mankind which has been priced at a significant discount to Abbott’s product). Further, another of its biggest product by value – Thyronorm’s market share has also stagnated in last two years (at around 48%) and it has lost some market share in the last four years.
- New product launches: We do not see a strong enough pipeline of new product launches in the foreseeable future to offset the weakness in some of its existing products. Some of the new offerings introduced in India have been launched under the unlisted entity of Abbott, instead of the listed entity.
- Changes / attrition in the senior management layer: Abbott India has seen multiple changes at the top management level where the country heads have been replaced with employees from other geographies within Abbott’s global businesses. Most of these country heads had also served in their roles in Abbott India for only brief periods of time. Many of Abbott India’s business-segment heads have left the organisation and joined other pharmaceutical companies in India.
ICICI Lombard has been part of the coverage universe of CCP for several years, and this stock has been part of many other portfolios at Marcellus over the last three years. Here is the investment rationale for adding ICICI Lombard to Marcellus’ CCP portfolio:
The Non-life Insurance industry in India has clocked in ~16% CAGR in premium growth in the last two decades and offers long and secular growth potential as penetration is still low (~1% of GDP vs. 4% global average) across various lines of business. ICICI Lombard is the largest private non-life insurer in India with a high focus on profitability (profit market share is ~5x of premium market share). The firm has consistently reported industry leading RoE (20%+) while PAT has compounded at ~20% CAGR over last eight years. ICICI Lombard has always been a profitability focused company and has managed to find select niches of profit pools much before the competition owing to best in class underwriting and risk management functions. Moreover, the investment function is top-notch; the company has not seen any NPAs in the fixed income book since inception and has delivered healthy investment yields while keeping limited equity exposure. The senior management of ICICI Lombard has navigated the business well during turbulent times and has shown the ability and willingness to take a contrarian and countercyclical approach to protect ROE and reduce risks from mispricing.
Note: the above material is neither investment research, nor investment advice. Marcellus does not seek payment for or business from this material/email in any shape or form. Marcellus Investment Managers Private Limited (“Marcellus”) is regulated by the Securities and Exchange Board of India (“SEBI”) as a provider of Portfolio Management Services and as an Investment Advisor. Marcellus is also a US Securities & Exchange Commission (“US SEC”) registered Investment Advisor. No content of this publication including the performance related information is verified by SEBI or US SEC. If any recipient or reader of this material is based outside India and USA, please note that Marcellus may not be regulated in such jurisdiction and this material is not a solicitation to use Marcellus’s services. This communication is confidential and privileged and is directed to and for the use of the addressee only. The recipient, if not the addressee, should not use this material if erroneously received, and access and use of this material in any manner by anyone other than the addressee is unauthorized. If you are not the intended recipient, please notify the sender by return email and immediately destroy all copies of this message and any attachments and delete it from your computer system, permanently. No liability whatsoever is assumed by Marcellus as a result of the recipient or any other person relying upon the opinion unless otherwise agreed in writing. The recipient acknowledges that Marcellus may be unable to exercise control or ensure or guarantee the integrity of the text of the material/email message and the text is not warranted as to its completeness and accuracy. The material, names and branding of the investment style do not provide any impression or a claim that these products/strategies achieve the respective objectives. Further, past performance is not indicative of future results. Marcellus and/or its associates, the authors of this material (including their relatives) may have financial interest by way of investments in the companies covered in this material. Marcellus does not receive compensation from the companies for their coverage in this material. Marcellus does not provide any market making service to any company covered in this material. In the past 12 months, Marcellus and its associates have never i) managed or co-managed any public offering of securities; ii) have not offered investment banking or merchant banking or brokerage services; or iii) have received any compensation or other benefits from the company or third party in connection with this coverage. Authors of this material have never served the companies in a capacity of a director, officer or an employee.
This material may contain confidential or proprietary information and user shall take prior written consent from Marcellus before any reproduction in any form
Disclaimer
Marcellus Investment Managers is regulated by the Securities and Exchange Board of India as a provider of Portfolio Management Services and as an Investment Advisor.
The information provided on this Newsletter does not, and is not intended to, constitute investment advice; instead, all information, content, and materials available on this newsletter are for general informational purposes only. Information on this website may not constitute the most up-to-date information. The enclosed material is neither investment research, nor investment advice. The contents and information in this document may include inaccuracies or typographical errors and all liability with respect to actions taken or not taken based on the contents of this Newsletter are hereby expressly disclaimed. The content on this Newsletter is provided "as is;" no representations are made that the content is error-free.
No reader, user, or browser of this Newsletter should act or refrain from acting on the basis of information on this Newsletter without first seeking independent advice in that regard. Use of, and access to, this website or any of the links or resources contained within the site do not create an portfolio manager -client relationship between the reader, user, or browser and website authors, contributors and their respective employers. The views expressed at, or through, this site are those of the individual authors writing in their individual capacities only.
