Amongst Emerging Markets, India and China have produced the greatest number of Consistent Compounders (i.e., companies which have delivered 10% YoY revenue growth and 10% RoCE consistently over a decade). However, not only does India produce more Consistent Compounders than China, Indian Consistent Compounders have also delivered more than twice as much shareholder return as their Chinese counterparts. In this note, we dig into the underlying drivers of the superiority of Indian Consistent Compounders.

Quantifying Indian versus Chinese Consistent Compounding
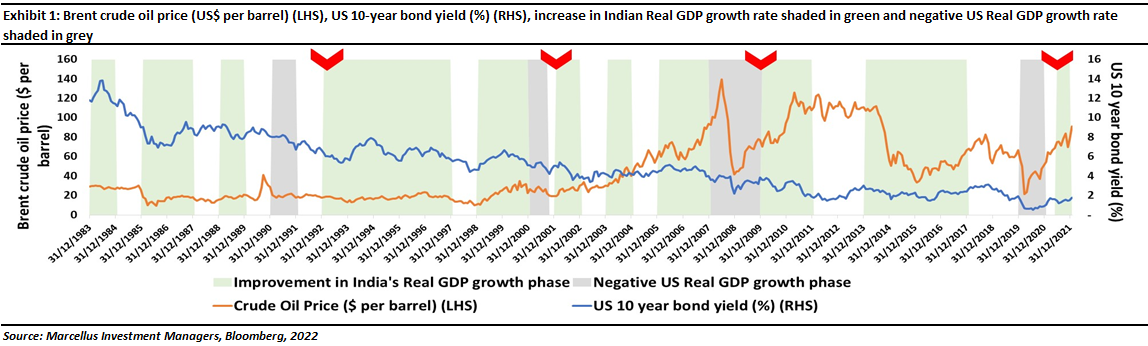
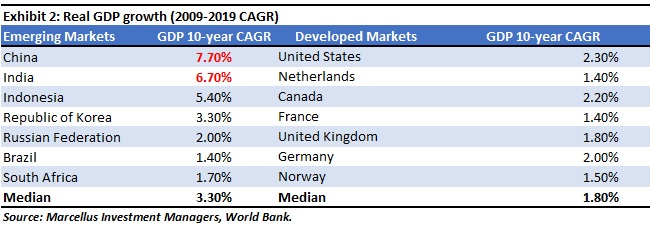
As is well known, not only have Emerging Markets (EMs) grown twice as fast as Developed Markets (DMs) over the past decade, China and India have been the fastest growing EMs if measured by growth in real GDP over the past decade.
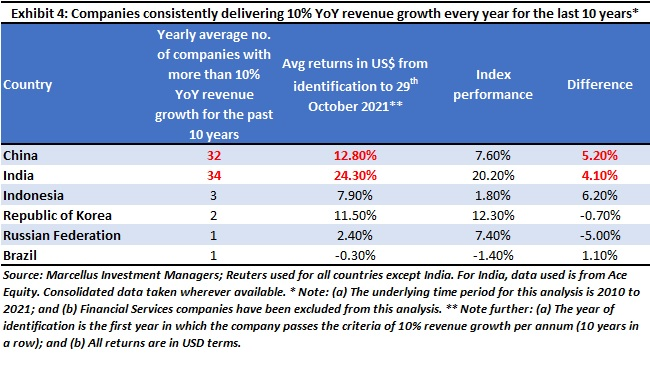
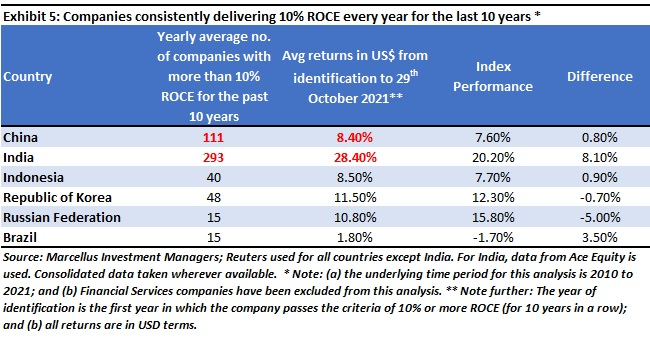
Unsurprisingly therefore, when it comes to producing Consistent Compounders (CCs) i.e., companies which grow their revenues by at least 10% every year for ten consistent years and generate a minimum ROCE of 10% throughout that period, India and China are head and shoulders ahead of any other EM. What is more intriguing however, is that although China’s economy is 5x larger than India’s (China’s GDP and India’s GDP in 2020), India has produced significantly more Consistent Compounders than China! Even more intriguingly, the Indian Consistent Compounders have compounded their share prices more than twice as fast as their Chinese counterparts (26% vs 10%).

Moreover, if we just apply 10% revenue growth filter and 10% ROCE filter each at a time (rather than simultaneously applying the two criteria – as has been done in the preceding exhibit), we get a similar conclusion, i.e., India and China stand far above other EMs and the Indian companies significantly outperform the Chinese companies in terms of shareholder returns.
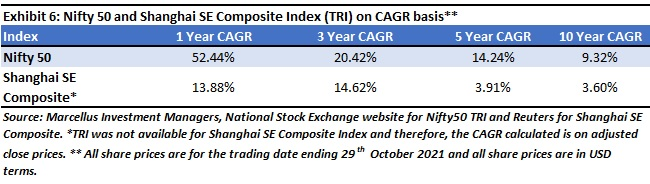
India produces more Consistent Compounders than China and the Indian Consistent Compounders compound almost three times as fast as the Chinese ones. Not only do the Indian Consistent Compounders outperform the local stock market far more comprehensively than their Chinese counterparts, at a broad index level basis, but the Nifty50 Total Return Index (TRI) has also outperformed Shanghai SE Composite (SSEC) TRI on 1, 3, 5, and 10-year CAGR basis (see Exhibit below).
So why do India’s Consistent Compounders perform so much better than China’s? What underpins this consistent superiority both in underlying fundamentals and in share price performance?
Polarization of profits is far more pronounced in India than China
Whilst we do not know exactly what is happening in China, what we can see from the data available for market leading Chinese and Indian companies is that the polarisation of profits (i.e., the share of the country’s PAT (Profit After Tax) accruing to the top 20 PAT generators) has been far more rapid in India than in China – see the opening Exhibit in this note.
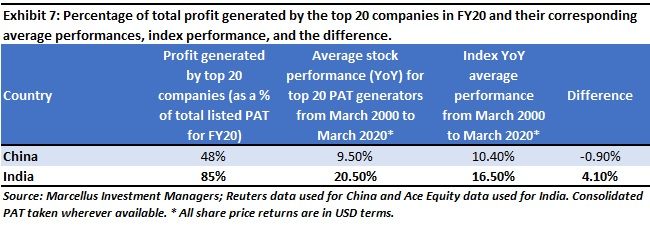
As shown in the exhibit 1 and exhibit 7, the share of PAT accounted for by the top 20 PAT generators in India is: (a) twice the level of their Chinese counterparts; and (b) has almost doubled (from 45% to 85%) the past ten years. These data points raise two questions: a) why has corporate profitability in India polarized in such a dramatic manner? And b) why has corporate profitability not polarized in China?
Focusing on point b), one possibility that exists that in China economic growth has been so broad based that smaller companies have grown faster than top 20 PAT generators. However, we don’t have in depth knowledge about Chinese economy to be able to answer this tricky question.
Focusing on a), the rise in corporate profitability of India’s top 20 PAT generators has been underpinned by the drivers of polarization, which are rippling through the Indian economy – see our June 2021 note (Three Distinct Layers of Polarization in the Indian Stock Market, 2021) which has been summarized below.
A networked economy helps more efficient companies
In our 1st March 2019 blog Exit the Kirana Store, Enter the Supermarket we had highlighted how over the past ten years, the length of roads in India has increased from 3.3 million km to 5.9 million km (CAGR of 6%). The number of mobile phone subscribers has increased over the same period from 392 million to 1161 million (CAGR of 12%). The number of broadband users has increased from 6 million to 563 million (CAGR of 57%). A decade ago, around 44 million Indians were taking flights each year. Now 3x as many Indians are flying each year (CAGR of 13%). 15 years ago, only 1 in 3 Indian families had a bank account; now nearly all Indian families have a bank account.
As a result of this networking of the Indian economy, efficient companies with strong distribution systems have pulled away from regional & local players. For example, as the economy gets integrated, lending, which was once dominated by regional players is now seeing the emergence of a few national leviathans like HDFC Bank and HDFC with both lenders entering the list of top 20 PAT generators over the last 10 years.
The global dynamic is the rise of affordable, easy-to-use enterprise technology which if implemented increases profit margins, reduces working capital cycles, and increases asset turnover. We now describe how India’s best compounders are using technology to create wealth for Marcellus’ clients.
Sunk costs drive industry concentration
In 1991, John Sutton of the London School of Economics wrote a prescient book titled ‘Sunk Costs and Market Structure’ which foresaw how the application of modern marketing techniques, of R&D, and of technology was leading to polarization of profits. Sutton said that companies which invest in brand building, in R&D – basically, invest in intangible assets (something that cannot be physically touched or felt) which are critical sources of competitive advantage – go on to dominate that industry provided, of course, intangible assets are a source of competitive advantage in that industry i.e., this theory is not applicable to sectors like cement and steel where intangibles confer little by way of competitive advantage. The technical name of such investments in intangibles is “Endogenous Sunk Costs” (ESC) and Sutton said that in absence of ESC, an industry would see tough price-based competition [which is exactly what we see in sectors like steel, cement, construction, and wherever else intangibles don’t matter].
Companies that invest in technology benefit from increasing returns to scale
Sutton’s book was followed by a remarkable paper published in 1996 in the Harvard Business Review by Brian Arthur. Titled ‘Increasing returns and the new world of business’, Arthur highlighted that the conventional idea of diminishing returns to scale is being replaced by businesses that are generating increasing returns to scale. Increasing returns basically mean the tendency of returns (on the goods produced or the services provided) to keep increasing as output increases whereas diminishing returns imply the opposite. In Arthur’s words: “As the economy shifts steadily away from the brute force of things into the powers of mind, from resource-based bulk processing into knowledge-based design and reproduction, so it is shifting from a base of diminishing returns to one of increasing returns. A new economics—one very different from that in the textbooks—now applies, and nowhere is this more true than in high technology. Success will strongly favor those who understand this new way of thinking.”
Tying this idea to what Sutton had said in 1991, several management gurus then pointed out in the years that followed that the nature of goods that are produced has changed radically from being bulk-produced and process-driven to increasingly being technology-driven and customized to a greater extent. This enables a positive feedback loop in the economy where one set of, say algorithms, once developed by someone can be applied to numerous other functions by tweaking them slightly at no extra cost, essentially making the idea of the marginal cost of production (the cost to produce one additional unit) redundant. Therefore, once returns start accruing for such companies, they continue to grow over time at an increasing rate. Furthermore, network effects (for example, the increased compatibility of software with multiple hardware devices and their development) kick in along with customers, who after some initial training, need only adapt a little as the products update, further strengthening the positive feedback loop.
Growth in profitability is increasingly NOT related to traditional Capex
Jonathan Haskel & Stian Westlake then developed this line of thinking further in their 2017 book “Capitalism Without Capital”. The central theme of the book is that corporate investments, in the past 40 years especially, have become increasingly intangible rather than tangible. Aggregating data for the developed world, the authors show that around the turn of the century, the developed economies started investing more in intangibles (which traditional accounting techniques do NOT capture as Capex) and less in tangibles (like factories & machines). The pre-eminence of intangible investing according to the authors have brought to the fore four effects that intangible assets showcase:
- Scale (intangibles are easily scalable to any length once developed initially),
- Sunk costs (intangibles have sunk costs tied to them i.e., costs that cannot be recovered),
- Spillovers (a company that makes an investment in intangibles may not be the only one, or not even the one to reap its benefits fully later; they are more often than not reaped by others), and
- Synergies (multiple intangible assets may collectively produce even higher returns than what they would produce individually).
These four effects are crucial for a company to become a consistent compounder because once a company scales using intangibles assets (such as a proprietary database), it can then extract spillovers from other companies’ investments in intangibles (such as a data analysis platform), and then create synergies between intangible investments (the proprietary database feeds the data analysis platform with big data) which can potentially help the company corner the entire industry (first in its home market and then in the global market).
A case study of compounding driven by intangibles and networks
Let us take a case study which we have written about in “The Unusual Billionaires” (see Chapter 2) and which illustrates beautifully, in the Indian context, Sutton’s, Arthur’s, Haskel & Westlake’s theories.
In 1970, Asian Paints invested Rs.80 million in the first supercomputer to be purchased by a private-sector enterprise in India. Asian Paints then used this computer to collect detailed data on paint demand – across its vast dealer network, for every colour, for every truckload delivered to every dealer. As a result, Asian Paints’ management developed greater familiarity with understanding and managing data than any other paint company in India. Through the 1980s, 90s, and through to the current day, they fed this data into increasingly sophisticated software platforms which helped them predict demand, time their raw material purchases and manage their inventory and production cycles such that the company’s working capital cycle in its decorative business (i.e., receivables + inventory – trade payables – other current liabilities) shrank to a mere six days from a hundred days 25 years ago.
A super crunched working capital cycle gave Asian Paints free cashflows which were 8x better than its competitors. The company re-invested these cashflows in expanding capacity (which has grown 15-fold in the last 25 years) and in further technology investments, for example, around cost optimization and around 3D visualization technology at its ‘Beautiful Homes’.
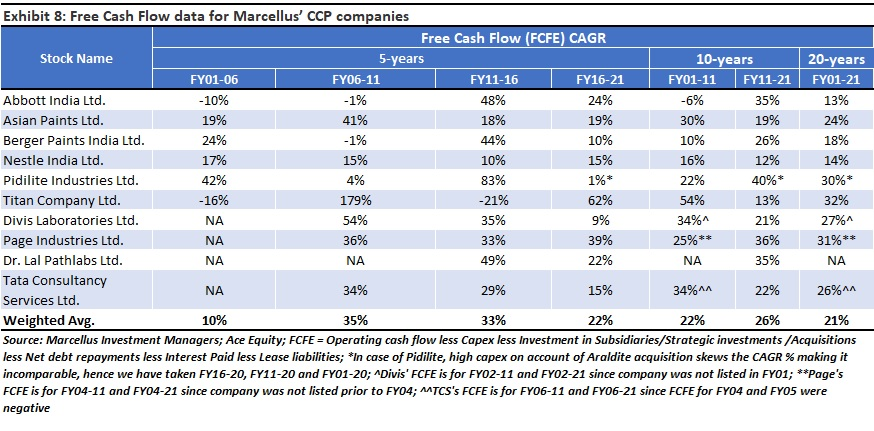
This dynamic creates a synergistic spiral which makes it difficult for Asian Paints’ competitors to compete with the firm (i.e., Asian Paints has better tech and more data and hence better cashflows which in turn leads to greater tech investments from Asian Paints which in turn leads more cash flow and so on). Having grown Free Cashflows over 70-fold in the last 20 years, Asian Paints is in amongst India’s most consistent compounders.
Implication for investors
Our research suggests that whilst China is the only other EM to rival India in producing Consistent Compounders, India’s Consistent Compounders mightily outgun their Chinese counterparts – both on fundamentals and on share prices – due to their ability to use the changes taking place in India to build dominant positions in the Indian market.
Saurabh Mukherjea, Omkar Sawant and Nandita Rajhansa are part of the Investments team at Marcellus Investment Managers (www.marcellus.in). Saurabh Mukherjea is the author of “Diamonds in the Dust: Consistent Compounding for Extraordinary Wealth Creation”.
Disclaimer
Marcellus Investment Managers is regulated by the Securities and Exchange Board of India as a provider of Portfolio Management Services and as an Investment Advisor.
The information provided on this website does not, and is not intended to, constitute investment advice; instead, all information, content, and materials available on this site are for general informational purposes only. Information on this website may not constitute the most up-to-date information. The enclosed material is neither investment research, nor investment advice. Marcellus does not seek payment for or business from this email in any shape or form. The contents and information in this document may include inaccuracies or typographical errors and all liability with respect to actions taken or not taken based on the contents of this site are hereby expressly disclaimed. The content on this website is provided "as is;" no representations are made that the content is error-free.
No reader, user, or browser of this site should act or refrain from acting on the basis of information on this [site/newsletter] without first seeking independent advice in that regard. Use of, and access to, this website or any of the links or resources contained within the site do not create an portfolio manager -client relationship between the reader, user, or browser and website authors, contributors and their respective employers. The views expressed at, or through, this site are those of the individual authors writing in their individual capacities only.