|
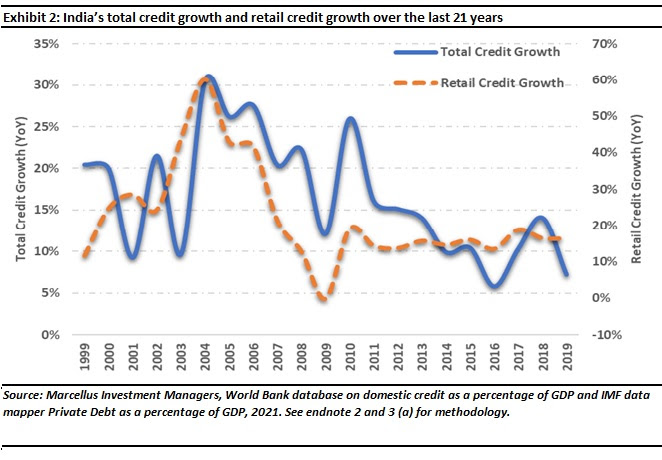
Paradoxically, this anemic credit growth in India has come during a decade of
- Remarkable technological progress in the broader world and India (e.g., the number of fixed broadband connections in India have gone up from 8 million in 2009 to 19 million in 2019, Source: Fixed broadband subscriptions, India
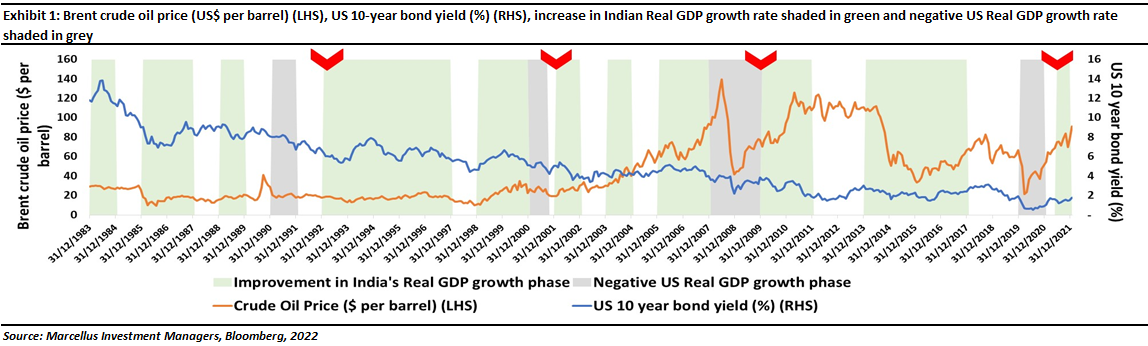
- Credit growth in other emerging markets have held up reasonably well during the decade (see exhibit 1 above)
- Stock markets globally and in India have performed reasonably well during this decade (S&P 500 by 13% CAGR, FTSE 100 by 2% CAGR, and Nifty100 by 12% CAGR for the last 10 years).
All of this raises two questions which we seek to address in this note:
- Why has credit growth in India been so weak over the past decade?
- What direction will credit growth move over in the coming decade?
To understand this, we looked at total credit growth (in nominal terms) and nominal GDP growth over the last 60 years for the world’s 50 largest economies. We used the World Bank data repository to get the domestic credit as a percentage of GDP metric. We then multiplied it with the GDP metric to arrive at the nominal figures for credit (in local currency units (LCU) billion) for the top 50 economies of the world (based on their GDP numbers at constant 2010 USD prices) and for the last 61 years. We then got the growth rates for this for the last 60 years, essentially giving us a total 3,000 data points (50 countries x 60 years). These countries were then further clubbed into four groups (High Income, Upper Middle Income, Lower Middle Income, and Low Income) basis their per capita income i.e., countries that have a per capita income of below USD 1,000 are defined as Low Income, those lying between USD 1,000 and USD 4,000 are Lower Middle Income (LMI) countries, those between USD 4,000 and USD 12,500 are defined as Upper Middle Income (UMI) countries, and those above USD 12,500 are defined as High Income (HI) countries. We then grouped the numbers basis decades and income brackets for total credit growth. A similar methodology was applied to nominal GDP growth data.
Coming to retail credit, we sourced data on total private debt (including corporate debt) as a percentage of GDP data from the IMF data mapper website. To arrive at just retail credit, we subtracted corporate debt as a percentage of GDP from private debt as a percentage of GDP. We then used the GDP numbers to arrive at retail credit (in LCU billion), whose growth rates were then calculated for the same 50 countries, for the last 60 years.
Key learning #1 from the data: The weakening relationship between GDP growth and total credit growth
We analyzed the correlations between credit growth and GDP growth over the last 60 years, for each decade, and especially LMI countries as India is one of them.
|
|
Exhibits 3, 4, and 5, show that the correlation between credit growth and GDP growth has clearly broken down, not only in the rich world countries but also in LMI countries, especially in the last 10-20 years. This trend seems to mimic what Jonathan Haskel and Stian Westlake have tried to explain in their book, ‘Capitalism Without Capital’ (2017).
As highlighted in our blog dated 24th June 2021, “wealth creation by Nifty companies is being driven by fewer and fewer companies that account for 80% of the wealth creation in the stock market.” This is because, as explained in the blog, “once a company scales using intangibles assets (such as a proprietary database), it can then extract spillovers from other companies’ investments in intangibles (such as a third-party software platform like SAP), and then create synergies between intangible investments (the proprietary database feeds the SAP with big data) which can potentially help the company corner the entire industry” (click here for the blog: Three distinct layers of polarization in the Indian stock market, 2021).
In case of Lower Middle Income (LMI) countries, however, if we take 10-year rolling CAGRs, the correlation between GDP growth and credit growth improves significantly suggesting that the Capitalism Without Capital thesis is as yet not fully relevant for LMI countries like India.
|
|
10 year rolling data also shows that typically, total credit growth is 10-15% higher than GDP growth.
|
|
Applying exhibit 7 to India, if we assume that nominal GDP growth will be around 10% p.a. in the next ten years, then overall credit growth in India seems likely to be around 11.5% in the next 10 years (1.15 ratio = 15% growth in credit over and above the GDP growth).
Key learning #2 from the data: The tight relationship between GDP growth and RETAIL credit growth
In stark contrast to the gradual disintegration of the relationship between economic growth and credit growth, the one relationship that has held up beautifully across the world is between GDP growth and retail credit growth, as evidenced in exhibit 8.
|
|
Furthermore, as shown exhibits 9 and 10 as a country gets richer, the retail credit to total credit ratio rises.
|
|
Forward looking implication #1: Total RETAIL credit growth in India is likely to be around 14% per annum
Given the tight relationship between higher per capita income and higher retail credit as a % of total credit (refer to exhibit 10), and given the tight relationship between retail credit growth and GDP growth (refer to exhibit 8 and exhibit 9), how fast will the retail credit grow over the next 10 years in India?
Taking total credit to GDP ratio of around 1.15 for 2011-20 from exhibit 7, we know that total credit growth is 15% faster than GDP growth. Therefore, assuming the nominal GDP growth ten years hence is 10%, we can say that total credit growth will be around 11.5%. If we assume total credit to be 100 in 2019, ten years later (and applying a CAGR of 11.5%) it will be around 297.
Now, using the median per capita income for UMI (¬$8k) and LMI (¬$2.5k) and private to total ratios for UMIs and LMIs at 39% and 18% respectively (from exhibit 9), we arrive at a growth rate of 3.8% in private credit to total credit ratio per $1k increase in per capita income. Using an assumption of 6% growth in per capita income in the next 10 years for India, we find that for an approximately $1.7k jump in India’s per capita income, the growth rate of private to total credit ratio will be around 6.5%. Using this growth rate and India’s private to total credit ratio in 2019 being 22%, we arrive at 10 years hence rate of ¬28%. Multiplying this 28% private credit to total credit ratio with the aforementioned total credit of around 297 will give us a retail credit to total credit ratio of around 85, implying a 14% CAGR in private credit.
Forward looking implication #2: Total RETAIL credit growth in India for PRIVATE sector banks likely to be around 17% per annum
We arrive at the market share of private sector banks in retail credit in India using the market share of the top 4 private sector banks. This comes to around 52.4% in 2026, and around 47.6% for public sector banks.
This number is then utilized along with the 14% retail credit growth and 11.5% industry credit growth (as derived from the ratio between total credit and GDP in exhibit 7 as 1.15 implying a 15% higher growth in credit over and above the nominal GDP growth – assumed to be 10% here) to arrive at the retail credit growth per annum by the private sector and public sector lenders. The growth numbers are as follows:
|
|
Therefore, retail credit is expected to grow by a CAGR of 17% for private sector banks and by 9% CAGR for public sector banks until 2026. In other words, the market share of private sector banks is expected to grow and that of public sector banks is expected to fall by 1.9% p.a. each year.
India’s outlook, therefore, in terms of credit, and especially retail credit uptake looks bright. According to one of India’s most experienced private sector lenders (a conservative banker not known for exaggeration and hyperbole), “If some ‘contributors’ to credit (like India’s young population, higher rate of conversion to formal banking transaction economy, and integration of technology) play out in India, retail credit as a percentage of total credit will rise way above the 18% median figure of LMI countries”.
|
|
Nandita Rajhansa and Saurabh Mukherjea work in the Investments team in Marcellus Investment Managers (www.marcellus.in)
|
|
Endnotes
1: The metric was first converted into credit (in Local Currency Units (LCU) billion) for top 50 countries basis their GDP figures over a 60-year period, whose 10-year CAGR was then calculated (for e.g., a 10-year CAGR was calculated for 1992-2001, 1993-2002, and so on). The countries were then classified as either ‘High Income’, ‘Upper Middle Income’, ‘Lower Middle Income’, or ‘Low Income’ basis their per capita income, whose median of credit CAGR was calculated over 10-year periods.
2: The metric was first converted into credit (in LCU billion) basis GDP figures whose YoY percentage change was calculated to arrive at Total Credit Growth.
3 (a): For arriving at Retail Private Credit Growth, Corporate Debt as a percentage of GDP was subtracted from Private Debt as a percentage of GDP to get only private/retail credit as a percentage of GDP. This was then converted into private credit (in LCU billion) whose YoY percentage change was then calculated.
3 (b): In case of 10Y CAGR, 10Y CAGR for retail credit metric (see 3 (a)) was calculated for retail credit growth whose median was calculated for each decade.
4: Retail credit (see endnote 3 (a)) was divided by total credit for top 50 countries over a 60-year period. The newly formed metric’s median was calculated across income groups (basis the countries’ per capita income) and across decades.
|
|
|
|